FMP
ADX Meaning: Identifying Strong Market Trends for Strategic Analysis
Sep 3, 2025 12:12 PM - Parth Sanghvi


Image credit: Financial Modeling Prep (FMP)
Analysts face a central challenge: most of a stock's price action is noise rather than signal. Technical analysis literature, including the work of J. Welles Wilder Jr., suggests that markets spend the majority of their time—often estimated at 60-70%—in range-bound, non-trending phases.
The real edge comes from distinguishing those quiet, indecisive periods from the powerful trends that drive returns. That's where the Average Directional Index (ADX) becomes essential: a technical indicator designed to cut through the static and measure the conviction behind price movement.
What is the ADX Indicator? A Foundational Concept
The Average Directional Index (ADX) is a momentum indicator that quantifies the strength of a trend, not its direction. Developed by J. Welles Wilder, it is displayed as a single line, ranging from 0 to 100.
A rising ADX signifies a strengthening trend, while a falling ADX indicates a weakening trend. This single metric provides a powerful filter for analysts, helping them avoid "choppy" markets and focus on assets with clear directional momentum.
The ADX's power lies in its ability to confirm a trend's conviction, providing a layer of confidence that other indicators, like moving averages or oscillators, cannot provide alone. It acts as a confirmation signal for both upward and downward market moves, making it a universal tool for various strategies.
The ADX is part of the broader Directional Movement Index (DMI) system, supported by two other key lines: the +DI (Positive Directional Indicator) and the -DI (Negative Directional Indicator). These two directional indicators are the core of the system's ability to define trend direction, while the ADX line itself provides the critical context of its strength.
The ADX Line: Measuring Trend Strength
The ADX line itself is the core of the system. It is a non-directional indicator, meaning it measures the magnitude of the trend, not whether it is bullish or bearish. The value ranges from 0 to 100.
A rising ADX signifies a strengthening trend, while a falling ADX indicates a weakening trend. This line is the ultimate filter, allowing analysts to immediately discard assets in a non-trending, or "choppy," phase. A stock with an ADX below 20 might be flagged for lower allocation or even divestment, as it signals a lack of conviction that could lead to unpredictable price movements.
The Directional Indicators (+DI and -DI)
The ADX's directional nature comes from its two companions. The +DI measures the strength of an upward price move. When the +DI is above the -DI, it suggests buyers are in control, and the trend's direction is upward.
Conversely, the -DI measures the strength of a downward price move. When the -DI is above the +DI, sellers have the momentum, and the trend's direction is downward. By observing the crossover and separation of these two lines, analysts can confirm the direction of the trend that the ADX line has already flagged as strong.
A widening gap between the +DI and -DI in conjunction with a rising ADX is one of the most powerful signals a quant researcher can find for building a high-probability model.
Deconstructing the ADX Calculation for Actionable Insights
For a quantitative researcher, knowing how to interpret the ADX is one thing; understanding its calculation is another level of expertise. The process begins with raw price data and builds up to the final ADX value. While platforms can provide the final number, an analyst must understand the underlying logic to identify when the indicator might be providing a false signal.
The calculation is a multi-step process that requires foundational market data.
Example Calculation Breakdown:
|
Date |
High |
Low |
Close |
+DM |
-DM |
TR |
|
Day 1 |
105 |
100 |
103 |
- |
- |
- |
|
Day 2 |
108 |
102 |
107 |
3 |
0 |
8 |
|
Day 3 |
109 |
105 |
108 |
1 |
0 |
7 |
|
Day 4 |
106 |
100 |
102 |
0 |
5 |
8 |
|
... |
... |
... |
... |
... |
... |
... |
- Step 1: Calculate True Range (TR): For Day 2, the TR is the largest of three values: (1) High-Low (6), (2) High-Prev.Close (5), or (3) Prev.Close-Low (8). The TR is 8. This ensures volatility, including price gaps, is accounted for.
- Step 2: Calculate Directional Movement (+DM and -DM): On Day 2, the +DM is Today's High (108) minus Yesterday's High (105), which is 3. The -DM is Yesterday's Low (100) minus Today's Low (102), which is -2. Since the upward movement is greater than the downward, we use +DM = 3 and -DM = 0.
- Step 3: Smooth the Values: After 14 periods of this calculation, the raw TR, +DM, and -DM values are smoothed using a modified exponential moving average to provide a more stable trend signal, filtering out daily volatility.
- Step 4: Calculate +DI and -DI: The smoothed +DM and -DM values are divided by the smoothed TR to get the directional indicators.
- Step 5: Calculate the ADX: The final ADX value is a smoothed average of the Directional Movement Index (DX), which quantifies the difference between the +DI and -DI.
This meticulous, step-by-step process showcases the robustness of the ADX. For a CIO, understanding these layers of calculation translates into a deeper appreciation for the risk-management capabilities of any model built on the ADX framework.
Accessing ADX With the FMP API
While it's useful to understand how the ADX is constructed, in practice, analysts and quants rely on APIs to calculate and deliver values efficiently.
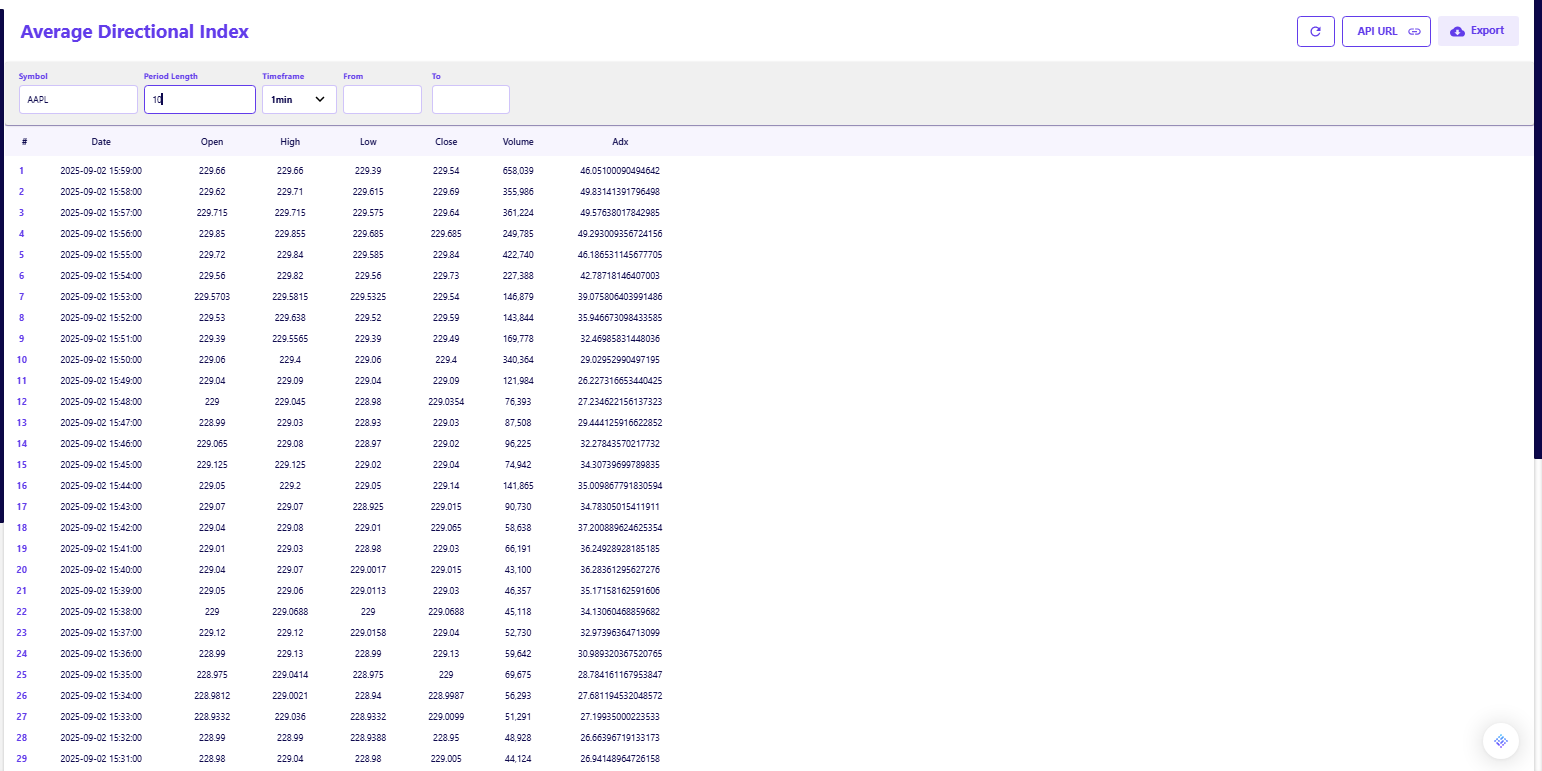
The FMP Average Directional Index API provides direct access to ADX values along with the open, high, low, and close data needed for calculation. Analysts and quant researchers can use query parameters such as symbol, periodLength, and timeframe to request specific data points. For example, a query for AAPL at a 1-minute timeframe will return both the ADX and supporting market data.
Values range from 0 to 100, where a rising ADX signifies a strengthening trend and a falling ADX indicates a weakening one. You can find more details and test endpoints via the official FMP Average Directional Index API documentation.
By combining the manual logic with API access, quants can both validate their understanding of the formula and scale analysis across thousands of tickers in real time.
Interpreting ADX for Trend vs. Range-Bound Conditions
This is where the ADX moves from a mere number to a powerful strategic tool. By understanding the key thresholds, a finance executive can rapidly assess the market environment and align their strategies accordingly. For a Quant Lead, this is the primary signal for model selection.
Range-Bound Markets (ADX below 20)
When the ADX is below 20, it signals a weak or non-existent trend. In this state, the +DI and -DI lines are often close together, crisscrossing frequently. This indicates a period of consolidation, where buying and selling pressure are in relative equilibrium, leading to "choppy" price action.
Strategic Action:
- Avoid trend-following strategies. A low ADX helps avoid the "whipsaw" effect, where a model falsely identifies a trend in noisy data.
- Favor mean-reversion tactics. These strategies profit from price oscillating between defined support and resistance levels.
- Reduce capital exposure in that asset class until a clear trend emerges.
Example: A mock data set for stock ABC shows an ADX of 15, with the +DI and -DI lines constantly crossing. This indicates the stock is in a period of consolidation. An analyst would know to either sit on the sidelines or apply a range-trading strategy, such as buying at the lower Bollinger Band and selling at the upper. The lack of a strong ADX confirms that the stock lacks the conviction to break out of its established range. You can validate similar non-trending conditions with data from the FMP's Average Directional Index API.
When ADX breaks above 25, the market dynamic flips entirely from consolidation to conviction.
Trending Markets (ADX above 25)
When the ADX rises above 25, it confirms that a strong trend is in motion. The higher the ADX value climbs, the stronger the trend becomes. This is the environment where trend-following models thrive, and capital can be deployed with higher confidence.
Strategic Action:
- Get a green light for trend-following strategies. When an asset's ADX climbs above this level, it's a high-confidence signal for a quant model to take a position in the direction of the dominant directional indicator (+DI or -DI).
- Confirm directional conviction. A strong ADX on a commodity or currency could inform a hedging strategy, locking in favorable rates while the trend persists.
- Justify larger capital allocation. This data validates a long position and justifies a larger capital allocation.
Example: Imagine mock data for stock XYZ shows its ADX rising from 22 to 34. Simultaneously, the +DI line has decisively crossed above the -DI line and is maintaining a wide gap. This is a clear, confirmed uptrend. For a quant researcher, this data validates a long position and justifies a larger capital allocation. You can get similar data for thousands of securities via FMP's Average Directional Index API.
The Synergistic Power of Combining Indicators
The ADX shows its real strength when paired with other indicators as part of a broader strategy. With the FMP Technical Indicators API, analysts can layer ADX alongside complementary metrics—moving averages, momentum oscillators, or volume signals—to create more resilient, risk-aware models.
For practical use, the FMP Average Directional Index API delivers not only the ADX value but also the underlying open, high, low, and close data required for calculation. This enables quants to quickly screen for assets with conviction-driven trends before applying deeper analysis.
ADX as a Trend Filter
An analyst might use the ADX as a primary filter. First, they query FMP for all stocks with an ADX value over 25. This removes all non-trending stocks from their universe. This simple but powerful step reduces the pool of potential assets to those with a clear, established trend, significantly improving the signal-to-noise ratio for any subsequent analysis. It's a core component of a top-down strategic approach.
A Strategic Crossover Signal
Next, from this refined list, they look for a signal from a secondary indicator, such as a Moving Average Crossover. When the 50-day moving average crosses above the 200-day moving average and the ADX confirms a strong trend—the signal is far more reliable and actionable. This two-step process reduces false signals and increases the probability of a profitable trade. For example, a "golden cross" (50-day MA crossing above 200-day MA) that occurs when the ADX is below 20 could be a false signal, while the same event with an ADX of 30 would be a strong buy signal. This contextual analysis is what separates a novice from an expert.
A Data-Driven Edge in Financial Analysis
Mastering the adx meaning is fundamental for any analyst seeking to move beyond surface-level analysis. By distinguishing between trend strength and noise, the ADX enables more precise entry and exit decisions, and more robust backtesting of trading strategies. FMP's APIs streamline this process, providing not just the pre-calculated ADX but also the raw historical data necessary for deep, customized analysis. This combination of granular data access and powerful pre-computed indicators allows financial professionals to build a formidable analytical framework.
By integrating the FMP Technical Indicators API into your workflow, you can automate data retrieval and gain a decisive edge. It's an essential tool for building sophisticated, data-driven strategies that capitalize on market momentum while mitigating the risks of non-trending price action. For CFOs focused on capital allocation, CIOs managing portfolio risk, and quant leaders building predictive models, the ADX is an invaluable compass in the volatile world of financial markets.
FAQs
What is a good ADX value for a strong trend?
An ADX value above 25 is generally considered to indicate a strong trend. The higher the value, the stronger the trend.
How is the ADX different from RSI or MACD?
The ADX measures trend strength, while indicators like the RSI (Relative Strength Index) and MACD (Moving Average Convergence Divergence) are oscillators that measure the speed and momentum of price changes.
Can the ADX indicator predict price direction?
No, the ADX itself measures only the strength of a trend. The trend's direction (up or down) is shown by the +DI and -DI lines that are part of the broader Directional Movement Index (DMI) system.
What timeframe is best for using the ADX?
The ADX is a versatile indicator and can be used on any timeframe, from intraday charts to daily, weekly, or monthly charts. The choice of timeframe depends on the analyst's trading strategy or investment horizon.
How do quant researchers use ADX in their strategies?
Quant researchers use the ADX to filter for trending markets, build trend-following models, and confirm the strength of signals generated by other indicators to increase the probability of successful trades.
Why is the ADX a lagging indicator?
Because the ADX is based on a series of smoothed averages, it can be slow to react to new price changes, and therefore is considered a lagging indicator. It confirms the existence of a trend rather than predicting its start.
Other Blogs

Walk Me Through a DCF: A Simple Guide to Discounted Cash Flow Valuation
Are you curious about how professional investors decide whether a stock might be one of the best undervalued stocks to b...

Technical Analysis 101: Understanding Support and Resistance
Technical analysis is a fundamental approach used by traders to forecast price movements based on historical market data...

How an Economic Moat Provides a Competitive Advantage
Introduction In the competitive landscape of modern business, companies that consistently outperform their peers ofte...