FMP
How Data Asymmetries Drive Predictable Market Volatility
Sep 12, 2025 11:48 AM - Parth Sanghvi


Image credit: Financial Modeling Prep (FMP)
What if a significant portion of market volatility wasn't random, but a direct consequence of a predictable, regulatory-driven data lag? For risk-aware executives, this isn't a theoretical question it's a strategic imperative.
Many critical financial insights arrive with a significant delay. This "data asymmetry" where some market participants gain access to information far later than others doesn't just hinder market efficiency; it actively creates windows of predictable risk.
This article provides a framework for financial leaders to move from reacting to these events to anticipating them, leveraging strategic data access to fortify their risk management posture.
The Illusion of Market Efficiency: When Information Lags Become a Liability
For a Chief Investment Officer (CIO) or a quant leader, the bedrock of a robust strategy is the assumption of a mostly efficient market, where all available information is priced in. However, this is an illusion in practice.
Data asymmetry isn't a conspiracy; it's a structural reality of the market, often driven by mandated regulatory reporting cycles. When crucial information is released in concentrated, scheduled bursts rather than incrementally, it creates a fertile ground for predictable volatility.
The most classic example of this is the Form 13F filing. These are quarterly reports required by the U.S. Securities and Exchange Commission (SEC) for institutional investment managers with over $100 million in assets under management (AUM). The purpose is to increase transparency and provide a glimpse into the holdings of major players like hedge funds, mutual funds, and pension funds.
The inherent tension lies in the built-in time delay: these filings are disclosed up to 45 days after the end of a quarter. This delay means a massive amount of market-moving information is held back from the public for weeks, only to be released in a sudden, coordinated wave.
This "lag effect" is the key insight for executives: it creates a fertile ground for a "crowding-in" effect, as analysts and traders rush to react to a sudden, coordinated release of new information.
The Regulatory Reporting Cycle and Its Lag Effect
A Form 13F filing is designed to disclose the long equity holdings of institutional money managers. While this provides valuable transparency, the built-in time delay creates a fertile ground for a "crowding-in" effect. The sudden, coordinated release of new data revealing which stocks the biggest players have been buying and selling can trigger a chain reaction as other investors, both retail and institutional, rush to reposition their own holdings.
This lag isn't just a minor inconvenience; it's a structural feature of the market. For analysts, this means the key is not to react to the filing, but to anticipate its impact. By knowing when these massive data dumps are scheduled, an analyst can prepare their models and portfolio alerts to respond strategically, rather than being caught in the reactive herd.
From Lag to Leverage: Why Form 13F Filings Spark Volatility
When a major institution's Form 13F is publicly disclosed, revealing a significant position in a stock, it can trigger a powerful chain reaction.
This includes a "herding" behavior (a phenomenon where investors follow the actions of a large or successful group) among retail investors and swift repositioning by other institutions that now have a clearer view of what the "smart money" is doing. This isn't just mimicry; it's a strategic response to a sudden inflow of credible, though delayed, data.
Case Study: Quantifying the Post-Disclosure Volatility Spike
You can't manage what you can't measure. For a quant researcher, the goal is to move beyond conceptual understanding to building a repeatable, data-driven workflow. This process involves two key steps: anticipating the release and then quantifying its impact.
Step 1: Anticipate the Trigger with the FMP 13F Filings Dates API
The first step is to predict the timing of the information release itself. The FMP Form 13F Filings Dates API is built for this exact purpose.
Instead of manually checking the SEC's website, you can programmatically query the API to get a list of all historical and upcoming 13F filing dates. This allows you to build a dynamic "watchlist" for a specific time period.
For example, a request for a firm's filing dates would look like this: https://financialmodelingprep.com/api/v3/form-thirteen-date/[CIK]?apikey=YOUR_API_KEY. The output is a simple JSON array of dates. This data allows you to create alerts or simply check your list as the quarter end approaches.
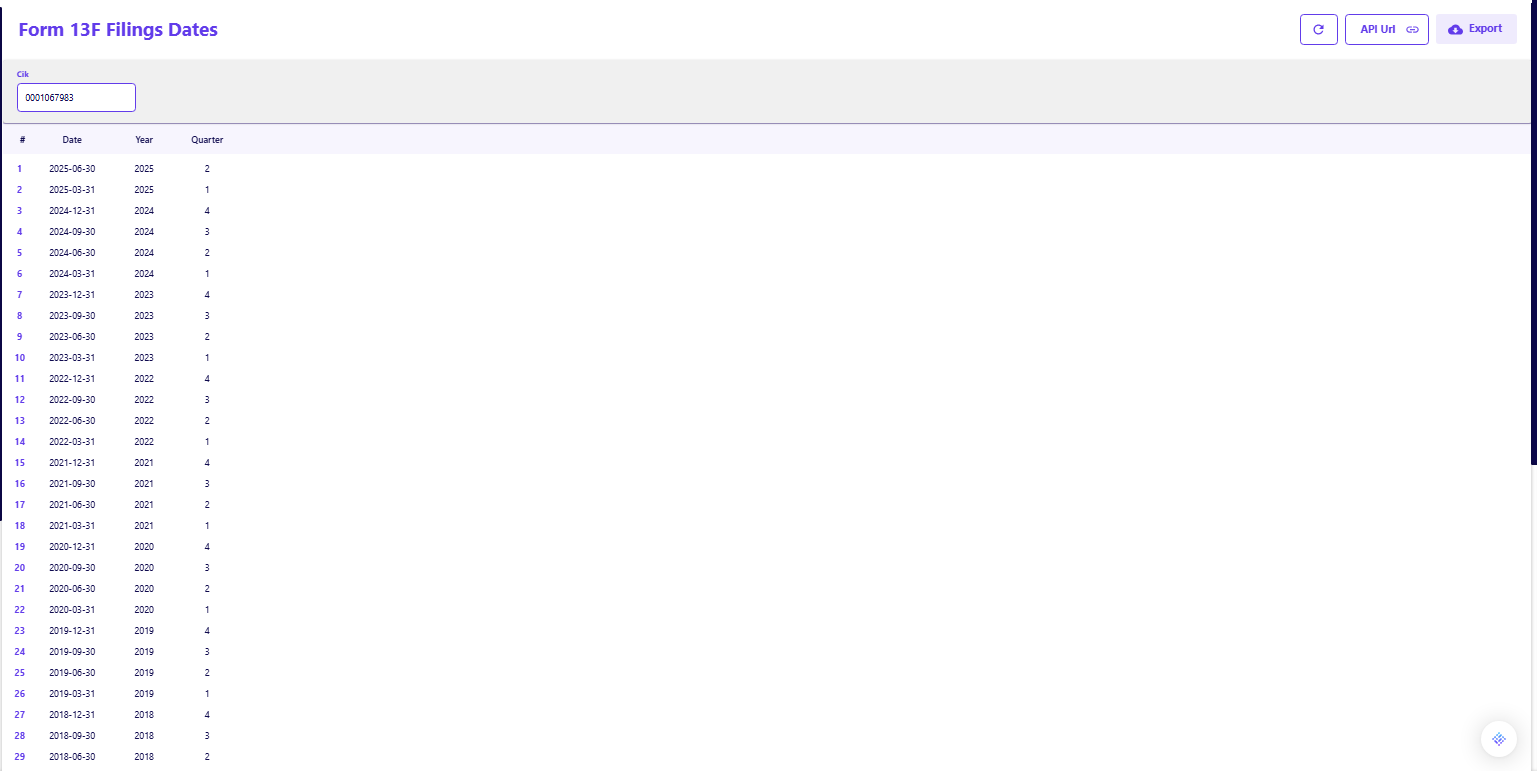
By using an API, you and your team can move from a reactive position to an anticipatory one, building a strategic calendar of potential market events.
Step 2: Quantify the Impact with the FMP Historical Stock Price and Volume API
Once you've identified a filing date for a firm holding a significant position in a stock you follow, the next step is to quantify the historical market reaction around that specific event. This is where the FMP Historical Stock Price and Volume Data API becomes essential.
You can query this API to retrieve daily trading data for a given ticker over a specified time period. For example, to analyze the impact of a recent filing on a company like Apple (AAPL), your API request would look like this:
https://financialmodelingprep.com/api/v3/historical-price-full/AAPL?apikey=YOUR_API_KEY.
The output, as shown in the image, gives you detailed end-of-day (EOD) data including open, high, low, close, and most importantly, volume.
By cross-referencing this data with your Form 13F dates, you can visually or programmatically identify spikes in volume and volatility that correlate directly with the filing dates. This analysis moves the conversation from a qualitative theory to a data-backed reality.
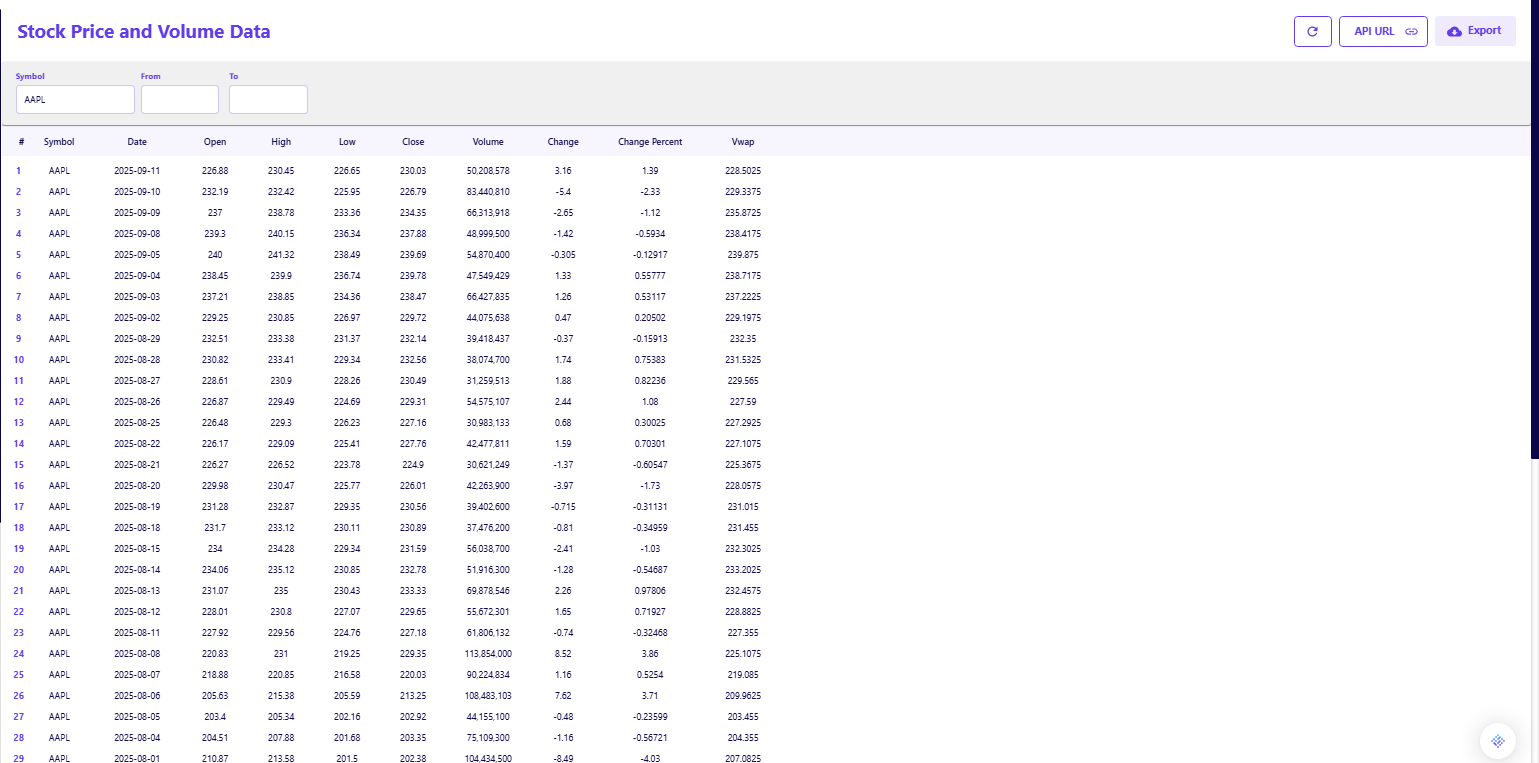
Test this pattern yourself. Use the FMP Stock Price and Volume API to analyze the historical price and volume data of a stock with significant institutional ownership and look for spikes around its Form 13F filing dates.
Proactive Risk Management in a Data-Lagged World
For a Head of Strategy or a Chief Risk Officer (CRO), understanding this dynamic allows for a proactive approach to portfolio management and risk mitigation.
The goal is to move beyond simply observing the problem to implementing a solution. This is a strategic pivot from passive observation to active anticipation. Instead of scrambling to react to a sudden price swing, your firm can be ready for it.
Using data APIs is not just about getting information; it's about building a more resilient, anticipatory framework.
Building a Predictive Framework with Data APIs
This section provides a concise, actionable guide for financial executives, optimized for a featured snippet.
- Map Your Exposure: Regularly cross-reference your firm's portfolio against institutional holdings data to identify assets where a sudden disclosure from a major player could trigger a volatility event. This helps to proactively identify and manage risk.
- Anticipate the Trigger: Systematically track upcoming Form 13F filing dates using a dedicated API. This creates a "watchlist" for potential volatility spikes, enabling your team to monitor these assets more closely in the days leading up to and after the filing.
- Model the Impact: Use historical price and volume data to run simulations of how similar disclosures have impacted asset prices in the past, informing your risk models. This quantitative backtesting provides a data-driven basis for setting risk parameters and contingency plans.
- Set Proactive Alerts: Create automated alerts based on filing dates and pre-defined volatility thresholds to prepare for potential market shifts before they occur. This allows you to front-run the crowd and execute strategies efficiently.
This workflow is about more than just data retrieval; it's about transforming raw information into a strategic advantage, allowing your team to inform capital allocation decisions and fortify portfolio resilience against anticipated market movements. The same principles can be applied to other data sets, such as turning earnings disappointments into a strategic advantage.
The Future of Risk Management: Anticipate, Don't React
Data asymmetry is not an abstract market theory; it is a fundamental, predictable driver of market volatility.
By embracing a proactive, data-driven strategy, finance executives can transform this structural risk into a competitive advantage. The days of simply reacting to regulatory filings are over. The future of risk management lies in anticipating the information events that drive the market, using the same data that creates the asymmetry as a tool to mitigate its effects.
To begin building your own anticipatory risk management framework, explore the full suite of financial data APIs available from FMP, offering everything from earnings transcripts to insider trading reports.
FAQs
What is data asymmetry in finance?
Data asymmetry in finance refers to a situation where some market participants have access to crucial financial information sooner than others. This is often caused by regulatory reporting schedules, like quarterly filings, which release information in concentrated bursts with a significant time delay for the public.
How do financial APIs help a Chief Risk Officer (CRO)?
Financial APIs provide a CRO with the tools to build a proactive risk management framework. By accessing real-time and historical data on filings, institutional holdings, and trading volume, a CRO can anticipate predictable volatility events and model their potential impact on the portfolio before they occur.
Do Form 13F filings cause market volatility?
Yes, Form 13F filings can cause market volatility. While they do not directly cause price changes, the sudden release of information on major institutional holdings can trigger a wave of buying or selling from other market participants, leading to a noticeable spike in trading volume and price fluctuations.
How can I track institutional investor filings to predict market movements?
You can track institutional investor filings by using a dedicated data API, such as the FMP Form 13F Filings Dates API. This allows you to create a "watchlist" of upcoming filing dates for key firms, helping you anticipate when market-moving information is about to be released.
What is the FMP 13F Filings Dates API?
The FMP 13F Filings Dates API is an endpoint that provides the official filing dates for Form 13F reports from institutional investment managers. It is a critical resource for anticipating when new data on institutional holdings will become public.
Why is historical price and volume data important for risk management?
Historical price and volume data are essential for risk management because they allow analysts to backtest and simulate how assets have reacted to specific events in the past. This provides a quantitative basis for understanding and modeling the potential impact of future market-moving events.
Is it possible to anticipate volatility spikes driven by regulatory filings?
Yes, it is possible to anticipate volatility spikes driven by regulatory filings. By understanding the predictable nature of data asymmetry and leveraging financial APIs to track filing dates and historical market reactions, financial professionals can build a strategic framework to prepare for these events rather than simply reacting to them.
Other Blogs

The Business Case for Filling Data Gaps Before They Cost You
Have you ever made a critical decision with incomplete data? If so, you’re not alone – and the consequences can be stagg...

How to Spot Hidden Liquidity Risks in Balance Sheets Before Markets Do
Liquidity risk is a quiet predator. It can cripple a company before its stock price even flinches. But what if you could...