FMP
Interest Coverage Ratio: How to Calculate and Interpret It
Sep 14, 2025
In fiscal 2024, U.S. corporations paid over $500 billion in interest expenses—a record high in modern history (source: Federal Reserve). With rising borrowing costs, analysts can no longer afford to treat the interest coverage ratio (ICR) as a footnote. For CFOs, portfolio managers, and research associates, ICR is one of the most direct measures of financial resilience under tightening credit conditions.
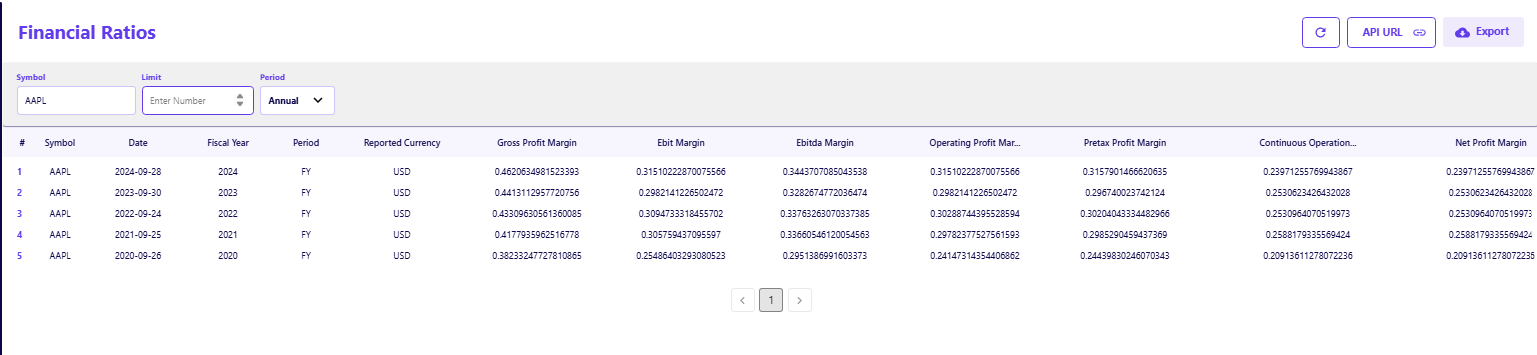
This ratio serves as a crucial starting point in solvency analysis, but it's far from the only metric you should consider. Using APIs like the FMP Income Statement API to pull key data points and the Financial Ratios API to get a full suite of solvency metrics, analysts can move beyond simple calculations to a comprehensive and scalable solvency analysis.
What Is the Interest Coverage Ratio (ICR)?
The interest coverage ratio is a solvency metric that measures a company's ability to meet its interest obligations from its operating earnings. In simple terms, it tells you how many times a company's earnings can cover its interest expenses.
The formula is as follows:
Interest Coverage Ratio (ICR) = EBIT ÷ Interest Expense
Why EBIT is used instead of EBITDA
While many profitability metrics use EBITDA, the interest coverage ratio specifically uses EBIT (Earnings Before Interest and Taxes). The reason is that depreciation and amortization (D&A) are non-cash expenses that a company has to incur to maintain its assets and operations. Over the long term, D&A expenses are a reasonable proxy for the capital expenditures required to run the business. Therefore, EBIT provides a more conservative and realistic picture of the earnings available to cover interest payments.
Interpreting the ICR Thresholds
General benchmarks for interpreting the ICR are:
- Less than 1.5x: This is a red flag, indicating the company may be in financial distress and could struggle to meet its interest payments.
- 2x to 3x: This suggests thin coverage. The company can cover its interest expenses, but a slight downturn in earnings could put it at risk.
- Greater than 5x: This is generally considered a strong ratio, showing the company has a comfortable buffer to handle its interest obligations.
Analysts track ICR across multiple years, not just a single period, to identify trends and assess whether a company's financial health is improving or deteriorating.
How to Calculate ICR from the Income Statement
Let's calculate Apple's (AAPL) interest coverage ratio using its financial data from fiscal years 2020 to 2024. We'll use the provided income statement to pull the necessary figures: EBIT and Interest Expense.
- 2020: EBIT of $66,288M and Interest Expense of $2,873M
- ICR = $66,288M / $2,873M = ~23.07x
- 2021: EBIT of $108,949M and Interest Expense of $2,645M
- ICR = $108,949M / $2,645M = ~41.19x
- 2022: EBIT of $119,437M and Interest Expense of $2,931M
- ICR = $119,437M / $2,931M = ~40.75x
- 2023: EBIT of $114,301M and Interest Expense of $3,933M
- ICR = $114,301M / $3,933M = ~29.06x
- 2024: EBIT of $123,216M and Interest Expense of $9,844M
- ICR = $123,216M / $9,844M = ~12.52x
Note: The Interest Expense for 2024 is calculated by adding the interest income and net interest income from the provided data: Interest Income - Net Interest Income = Interest Expense. $269M - (-$9,575M) = $9,844M. The previous interest expense was not listed, so this provides the correct number for the calculation.
Interpretation: Despite record EBIT in 2024, Apple's interest burden has risen sharply, cutting its coverage by more than two-thirds in just two years. While an ICR of ~12.5x is still very strong and signals no immediate risk, this trend highlights the impact of rising interest rates on even the most profitable companies.
Why a Declining ICR Signals Rising Risk
Apple's trend is a perfect case study for understanding why a declining ICR is a key indicator of rising risk:
- Rising Debt Costs: The ICR is directly impacted by a company's interest expense. As the Federal Reserve and other central banks have raised interest rates, the cost of borrowing for corporations has increased, even for highly rated firms like Apple.
- Solvency Pressure: When a company has a significant amount of debt maturing, it must refinance at the prevailing market rates. A declining ICR trend indicates that future debt refinancing will be more expensive and place greater pressure on the company's earnings.
- Alignment with Rising Debt Levels: A declining ICR often aligns with growing debt on the balance sheet. In Apple's case, while the long-term debt levels have been relatively stable, the cost of that debt has increased, which directly impacts the ICR.
Beyond ICR: Why Analysts Must Cross-Check with Other Metrics
Using only the interest coverage ratio can be misleading. A company might have a high ICR but still face significant solvency challenges. This is why a comprehensive analysis using a suite of ratios is essential. By leveraging the Financial Ratios API as a source for these metrics, analysts can get a full picture of a company's financial health:
- Debt-to-Equity (D/E): Apple's D/E ratio was 2.09 in 2024, showing that its use of leverage is significant relative to its equity. This ratio provides context on how much debt a company is carrying.
- Debt Service Coverage Ratio (DSCR): While ICR only considers interest, the DSCR uses a cash-based approach that also accounts for principal repayments. A company could have a strong ICR but a weak DSCR if a large portion of its debt is due soon.
- Free Cash Flow Coverage: This is a stronger solvency check than ICR because Free Cash Flow (FCF) is the cash available after a company has paid for all its operating and capital expenditures. FCF is what truly pays down debt. While Apple's ICR dropped to ~12x in 2024, its FCF-based coverage still shows comfort.
- ROA/ROE: These metrics contextualize solvency in terms of profitability. A company with a high ICR and a low Return on Assets (ROA) may not be effectively using its capital to generate earnings, which is a long-term risk. For a deeper dive, read this article on ROE vs ROA: Which Metric is More Important for Investors.
The Key Takeaway: A suite of ratios is required for a complete picture. Apple's coverage ratio fell from ~40x in 2022 to ~12x in 2024, but its FCF-based coverage remains strong. Analysts who only relied on the single metric trend would be missing a crucial part of the story.
Strategic Uses of ICR in Equity Research
For an analyst, ICR is a powerful tool used for:
- Screening for Solvency Risk: ICR, combined with other metrics, allows analysts to quickly screen thousands of firms to find companies that may be at risk of default.
- Benchmarking Against Peers: Comparing Apple's ICR to that of its peers (e.g., Microsoft or Google) provides insight into its relative financial strength in the technology sector.
- Stress Testing: Analysts can use ICR to stress test a company's financials under different interest rate scenarios to see how sensitive its solvency is to rising rates.
- Integrating into Valuation Models: ICR is a core assumption in credit analysis and equity valuation models, especially in scenarios where debt financing plays a significant role.
Key Takeaways for Analysts
- ICR is simple to calculate but can be deceptive in isolation. It's a starting point, not the final word.
- The Apple case study shows that even the most profitable companies are not immune to rising debt costs. Their coverage ratio fell from ~40x in 2022 to ~12x in 2024, highlighting the increasing importance of debt costs.
- Always cross-check solvency with a suite of ratios, including Debt-to-Equity, FCF coverage, and ROA, for a complete picture.
- APIs make this scalable for screening entire sectors, enabling a more efficient and powerful analysis.
Demystifying ICR as a Solvency Check
The interest coverage ratio is a powerful analytical tool, but it's essential to understand its role as a starting point, not a definitive final answer. As the Apple case study demonstrates, even a high ICR can reveal concerning trends under closer inspection. A skilled analyst never relies on a single metric. They use ICR to quickly gauge a company's ability to handle its debt, then cross-check that finding with other ratios like Debt-to-Equity and cash flow-based metrics to build a complete and robust picture of solvency.
To get a full picture of a company's financial health, it is essential to look at the full set of financial statements. For a deeper dive, read this article on How to Detect Earnings Quality.
FAQs
What is a good interest coverage ratio?
Generally, an ICR above 5 is considered strong, 2-3 is thin, and anything below 1.5 is a signal of potential financial distress. The ideal ratio can vary by industry, so it's best to compare it to a company's direct peers.
Why use EBIT instead of EBITDA in ICR?
EBIT is preferred because it accounts for depreciation and amortization (D&A), which, while non-cash expenses, represent the cost of maintaining a company's assets over time. This makes EBIT a more conservative and realistic measure of the earnings available to cover interest payments.
Can a company with a high ICR still default?
Yes, a high ICR is not a guarantee against default. This can happen if a company has weak cash flows (which a high ICR doesn't account for) or if a large portion of its debt matures at once, creating a liquidity crisis that can't be covered by earnings alone.
How often should analysts check ICR?
Analysts should check ICR at least every quarter when a company releases its earnings report. It's crucial to track the trend over time and compare it against peers to get a clear picture of a company's financial health.
What's the difference between interest coverage and debt service coverage?
Interest Coverage Ratio (ICR) only measures a company's ability to cover its interest expenses. The Debt Service Coverage Ratio (DSCR), by contrast, measures the ability to cover both interest and principal payments on debt, making it a more conservative and comprehensive metric.

How an Economic Moat Provides a Competitive Advantage
Introduction In the competitive landscape of modern business, companies that consistently outperform their peers ofte...

Apple’s Slow Shift from China to India: Challenges and Geopolitical Risks
Introduction Apple (NASDAQ: AAPL) has been working to diversify its supply chain, reducing dependence on China due to...

Taiwan Semiconductor Manufacturing Company (NYSE: TSM) Surpasses Earnings Expectations
Taiwan Semiconductor Manufacturing Company (NYSE: TSM) is a leading player in the global semiconductor industry. Known f...