FMP
Building a Market Insight Framework with FMP — Turning Price, Fundamentals, and Technicals into Actionable Research Signals
Nov 17, 2025
A stock can move sharply in just a few trading sessions, often driven by shifts in sentiment that fundamental models catch only after the fact. The challenge is separating meaningful signals from short-term noise in a way that supports fast, defensible decision-making.
FMP's APIs allow analysts to build a Market Insight Framework that unifies price data, fundamentals, and technical indicators within a structured interpretive process. This creates repeatable, evidence-based insights that support portfolio, sector, and risk management workflows.
Defining Alert vs. Insight Frameworks and the Need for Structured Reasoning
You do not need another alert stating that a stock is up five percent. What matters is the interpretation:
“The five percent gain is backed by rising volume, but the P/E ratio is now near the 90th percentile, indicating valuation risk and potential need for a hedge.”
This distinction is the core difference between alerts and insight frameworks.
Alerts (Reactive):
Single-factor triggers such as “volume is twice the 30-day average.” They draw attention but do not explain what is driving the move.
Insight Frameworks (Proactive):
Multi-factor models that connect price, volume, and valuation to form a coherent viewpoint. They provide context, reasoning, and strategic implications.
Building these frameworks strengthens your ability to explain why markets move and supports faster, more disciplined decisions on positioning and risk.
The Signal Architecture Canvas for Market Insight
The Signal Architecture Canvas provides a clean structure for transforming raw market data into strategic conclusions. It outlines how inputs such as price, valuation, and momentum interact to produce an insight and an associated action.
The Four Stages of the Canvas
|
Stage |
Description |
Strategic Goal |
Key Concept |
|
Input |
Normalized data from price, valuation, and technical metrics retrieved through FMP APIs |
Ensure complete and timely visibility |
Standardized fields such as P/E, RSI, or volume |
|
Logic |
Rules that define how inputs interact—for example: “If momentum strengthens and valuation expands, risk rises.” |
Build consistent reasoning |
Conditional models connecting data points |
|
Insight |
A single, defensible conclusion such as “Momentum is rising while valuation stretches.” |
Clarify market behavior |
Interpretive output aligned to the logic |
|
Action |
A decision informed by the insight |
Operationalize insight in research or risk workflows |
Portfolio adjustment, hedge, or review step |
Used consistently, this canvas makes analysis more transparent, repeatable, and ready for automation within research environments.
Comprehensive Mapping of FMP Datasets to Framework Inputs
A reliable framework depends on standardized, high-quality inputs. FMP's data products provide three essential pillars—price and volume, fundamentals, and technicals—each aligned with a distinct signal dimension.
Price and Volume (Conviction Signal)
Price movement tells you what happened, but volume helps determine why it matters. High-volume breakouts, reversals, or consolidations reflect the level of commitment behind the price move — especially from larger or long-horizon participants.
To capture this conviction layer, analysts use FMP's Stock Price and Volume Data API, which returns normalized end-of-day fields such as price, high, low, volume, and VWAP.
Endpoint Example:
https://financialmodelingprep.com/stable/historical-price-eod/full?symbol=AAPL&apikey=YOUR_KEY
This call provides the historical price series necessary to evaluate momentum and liquidity trends.
Sample Output:
[
{
"symbol": "AAPL",
"date": "2025-11-06",
"open": 267.89,
"high": 273.4,
"low": 267.89,
"close": 269.77,
"volume": 51204045,
"change": 1.88,
"changePercent": 0.70178,
"vwap": 269.7375
},
{
"symbol": "AAPL",
"date": "2025-11-05",
"open": 268.61,
"high": 271.7,
"low": 266.93,
"close": 270.14,
"volume": 43683100,
"change": 1.53,
"changePercent": 0.5696,
"vwap": 269.345
}
]
Framework Input Metric:
- 30-day average trading volume
Volume is especially important later in the Logic stage, where it either confirms or challenges the meaning behind price and valuation changes.
Fundamentals (Valuation Signal)
A framework is incomplete without a way to anchor market behavior to intrinsic value. Valuation ratios help determine whether a price move aligns with fundamentals or reflects a disconnect that requires closer inspection.
The Financial Ratios API provides standardized valuation metrics such as quarterly and TTM P/E ratios. These metrics allow you to identify expansions or contractions relative to historical norms.
Framework Input Metric:
- Quarterly or TTM Price-to-Earnings (P/E) Ratio
Fundamentals refresh more slowly than technical or price data, so they act as the stabilizing element of the canvas — the anchor against which momentum and conviction are compared.
Technicals (Momentum Signal)
Momentum provides timely context around the direction and strength of market participation. It answers a different question than valuation: Is the prevailing pressure accelerating or fading?
The Relative Strength Index (RSI) API provides this momentum lens, returning RSI values across selectable timeframes.
Endpoint Example:
This request provides RSI data over a 14-day period in JSON format and can be layered directly into the Logic stage for timing and risk evaluation.
Where fundamentals show long-term trend, RSI highlights shorter-term shifts in demand — a useful pairing in any multi-factor framework. You can easily boost this stage of your framework by exploring three ways to build momentum signals using FMP's forecast APIs for more advanced signal generation.
The technical data derived from this endpoint is typically returned in JSON format, providing price, volume, and the calculated RSI value across time stamps, as shown in the image below.
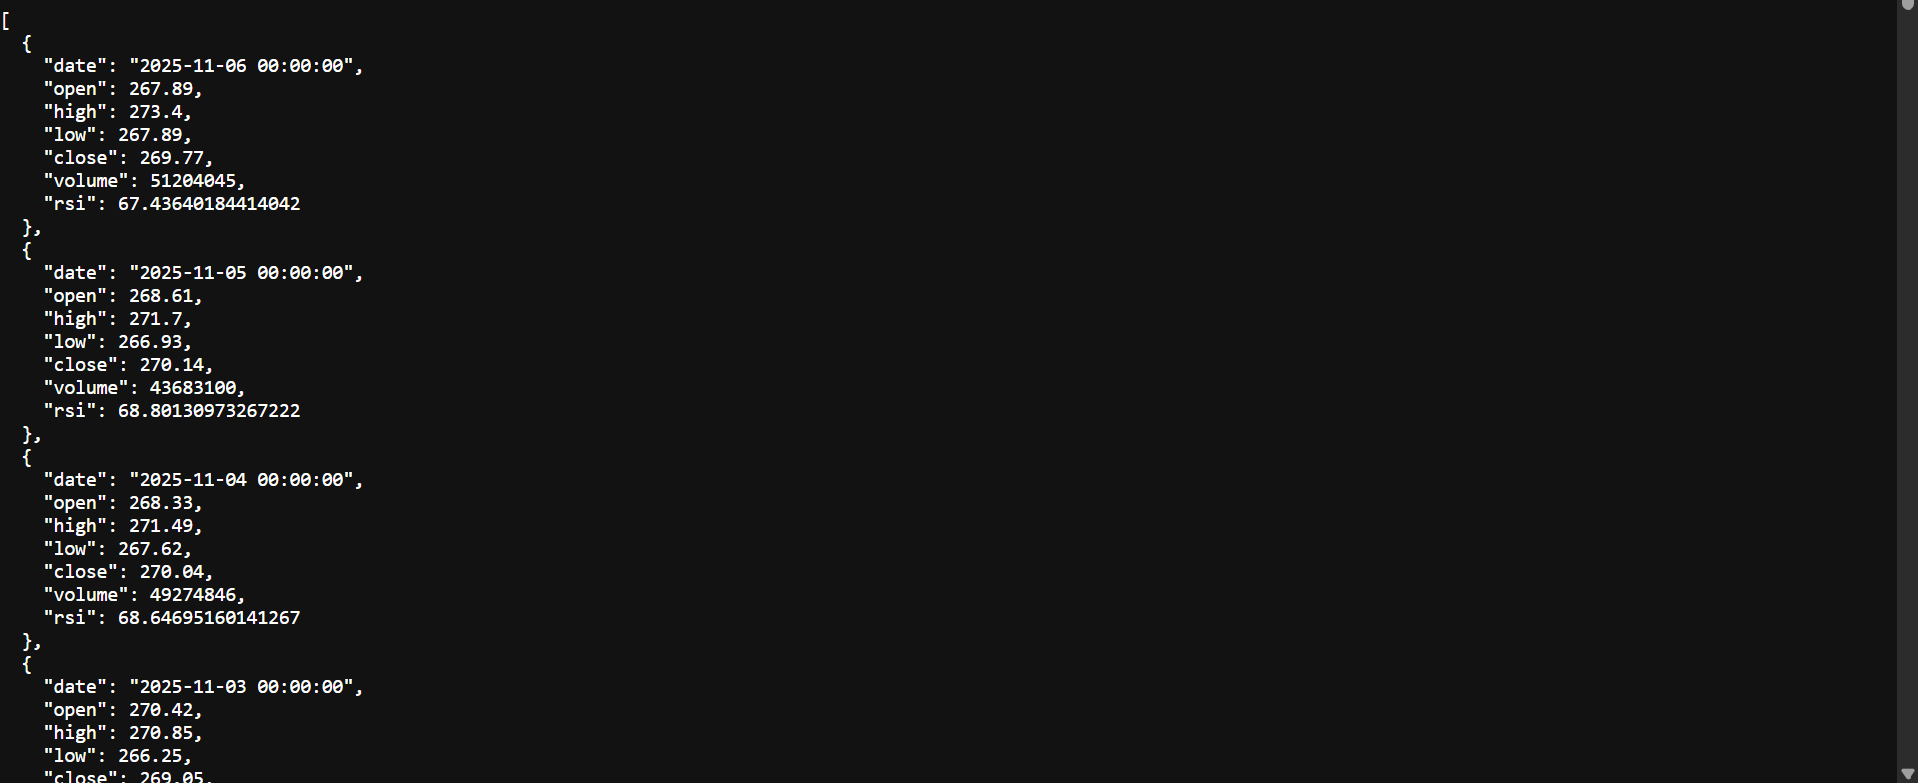
- Input Metric: 14-day Relative Strength Index (RSI).
Building a Sample Framework with Real Data
The Logic stage is where inputs become meaningful. Using Apple (AAPL) between Q3 and Q4 2025, you can see how momentum, valuation, and conviction combine to form an interpretable signal.
Step 1: Gather and Normalize Inputs
Using FMP's Technical Indicators API, Financial Ratios API, and Historical Price API, we collect the three key inputs:
|
Metric |
Q3 2025 |
Q4 2025 |
Interpretation |
|
RSI (14-day) |
63 |
67.4 |
Momentum strengthening; bullish bias |
|
P/E Ratio |
31.9x |
34.75x |
Valuation expanding; rising risk of overextension |
|
Average Daily Volume |
49M |
69M |
Participation increasing; institutional flow strengthening |
Each metric is normalized so it can be tested against consistent thresholds in the Logic stage.
Step 2: Define Logical Relationships
With the inputs aligned, we apply simple conditional rules that determine whether this combination of signals represents pressure, opportunity, or risk.
Examples using the Apple data:
- Valuation Stress:
When P/E expands by more than 5 percent and remains above 30, flag potential overvaluation. - Conviction Confirmation:
When average trading volume rises more than 20 percent and RSI exceeds 65, confirm strong participation — typically institutional.
These rules provide structure for interpreting otherwise isolated data points.
Step 3: Synthesize Insight
The conditions above trigger simultaneously in the Apple example. Momentum is rising, volume is surging, and valuation is expanding quickly. Together, they form a High-Conviction, High-Risk Rally signal.
The framework communicates something simple and essential: enthusiasm remains strong, but the margin for error has narrowed.
This is where structured reasoning becomes valuable: the data not only describes the move but explains the trade-off.
Step 4: Translate Insight into Action
With a clear insight, the framework guides potential decisions:
- Trim exposure while retaining upside
- Use a short-term hedge, such as a covered call
- Monitor RSI and volume to confirm whether the institutional participation persists
Between Q3 and Q4, Apple's P/E expanded nearly 9 percent and trading volume increased by more than 40 percent. The tension this creates — strong demand alongside rising valuation risk — is exactly the type of signal the canvas is designed to capture.
Step 5: Reuse and Adapt the Logic
Once the logic structure is established, it becomes a reusable building block. You can apply the same thresholds, modify them for different sectors, or integrate them into dashboards. Over time, these logic modules form a repeatable reasoning system that scales across teams and research workflows.
Systematizing Interpretation
By systematizing your analysis into these repeatable frameworks, your team moves beyond manual data comparison. Instead of manually inspecting thirty separate metrics, the framework pre-processes the data, allowing the strategist to focus their expertise on the final, critical step: assessing the trade-off and risk inherent in the synthesized Insight. This structured approach provides the conviction necessary to execute complex capital allocation and risk decisions rapidly.
Using the Framework in Portfolio and Sector Analysis
Building a structured Market Insight Framework makes market interpretation reproducible and scalable. It turns subjective judgment into repeatable, data-backed reasoning that can be applied across portfolios and sectors.
Portfolio Allocation and Risk Management
You can apply the Signal Architecture Canvas across your holdings to create a unified view of portfolio risk. Instead of analyzing dozens of metrics in isolation, the framework consolidates inputs into a single, weighted signal such as High-Risk Rally, Stable Base, or Accumulation Phase.
This unified scoring method enables faster and more consistent decisions regarding sector overweights, underweights, and hedging strategies. It replaces ad hoc judgment with structured, multi-factor logic that helps maintain discipline in portfolio construction.
Elevating Research and Analysis
The framework also changes how research is written and presented. Instead of collecting data for reports, you design and interpret logic models that explain why a move is happening and what it implies. This shift turns you from a data gatherer into a logic architect who builds reasoning systems that enhance credibility and analytical depth.
By using structured outputs like these, your reports move beyond data recitation toward clear, evidence-based narratives that strengthen confidence in your recommendations.
Putting the Framework to Work
You can test this framework with your FMP API key. Retrieve RSI and P/E data for a sector of your choice, then map those inputs onto the Signal Architecture Canvas. Identify three stocks that show divergent signals, such as momentum rising while valuation contracts, or valuation expanding while volume declines, and flag them for further research.
This exercise helps you see how structured logic can uncover early inflection points and bring consistency to your analysis.
Building Consistent Insight
Fragmented data alerts no longer meet the demands of fast-moving capital markets. The Market Insight Framework gives you a structured way to bring together price data, fundamentals, and technical indicators into one cohesive research signal.
By using the Stock Price and Volume Data API, the Financial Ratios API, and the Relative Strength Index (RSI) API, you can create logic models that are scalable and repeatable. This approach helps you move from reactive monitoring to proactive, evidence-based decision making grounded in multi-factor analysis.
FAQs: Building a Market Insight Framework
How is a Market Insight Framework different from algorithmic trading?
A Market Insight Framework is a research and reasoning model that supports human or systematic decision-making. Algorithmic trading executes those decisions. The framework determines what to buy, sell, or hedge, while the algorithm decides when and how to act.
Which FMP API is best for testing the Logic stage of the framework?
The FMP Financial Ratios API is best for testing the Logic stage because it provides standardized valuation and profitability metrics such as P/E and P/B. You can also combine this with the Technical Indicators API to align valuation logic with price momentum signals.
What is the biggest challenge in combining Technical and Fundamental data?
The biggest challenge is aligning timing and standardization. Technical data such as RSI or SMA updates continuously, while fundamental data such as P/E or EPS refreshes quarterly. The framework resolves this by using Trailing Twelve Month (TTM) fundamental ratios to maintain consistent, point-in-time comparisons.
How can I ensure the Input stage remains clean and reliable?
Use standardized, well-documented data sources. FMP's APIs already calculate and normalize metrics such as RSI and P/E, reducing the risk of calculation errors or inconsistent data in your framework.
Does this framework work for sector rotation analysis?
Yes. By calculating the average RSI, average P/E, and aggregated volume across all constituents within a sector (using FMP index constituent data), the framework can identify systemic signals. This allows you to determine whether a sector is fundamentally undervalued or technically overbought.

MicroStrategy Incorporated (NASDAQ:MSTR) Earnings Preview and Bitcoin Investment Strategy
MicroStrategy Incorporated (NASDAQ:MSTR) is a prominent business intelligence company known for its software solutions a...

WACC vs ROIC: Evaluating Capital Efficiency and Value Creation
Introduction In corporate finance, assessing how effectively a company utilizes its capital is crucial. Two key metri...

BofA Sees AI Capex Boom in 2025, Backs Nvidia and Broadcom
Bank of America analysts reiterated a bullish outlook on data center and artificial intelligence capital expenditures fo...

