FMP
Understanding Valuation Drift: Tracking Real-Time Sector Re-rating with FMP APIs
Nov 17, 2025
What is Valuation Drift? Moving Beyond Static Multiples
Many workflows treat valuation as a single number captured from a quarterly report or earnings snapshot. But static multiples miss what matters most: how valuation changes over time.
Valuation drift is the sustained change in a company's or sector's valuation multiple — such as P/E, P/B, or EV/S — relative to its historical mean or its peer-group median. Drift is not volatility; it reflects a directional repricing in the market's perception of value.
- Positive drift indicates that investors are consistently willing to pay a higher premium than before.
- Negative drift shows a widening discount, often signaling concern around future profitability, competitive pressure, or sentiment deterioration.
Measuring drift helps you identify re-rating trends, confirm thesis timing, and detect potential mispricings before consensus models adjust.
Static vs. Real-Time Ratio Tracking
To quantify valuation drift properly, you need valuation metrics that move with the market. Static annual or trailing ratios are useful for understanding long-term fundamentals, but they update slowly and often miss early changes in sentiment. When guidance shifts, liquidity tightens, or a sector experiences a re-rating, the static P/E reflects information that is already outdated.
Why Static Ratios Miss Early Signals
Static valuation metrics update only when companies report earnings. As a result, the multiple you see may not reflect what investors are pricing in today. In fast-moving sectors, this lag can obscure the first signs of sentiment change or competitive divergence — exactly the signals valuation drift is meant to surface.
How Real-Time and TTM Ratios Fix the Problem
Real-time and TTM ratios refresh continuously using the latest pricing data paired with trailing twelve-month fundamentals. This allows you to track valuation as it evolves, monitor shifts in expectations, and compare companies to sector medians without waiting for quarterly filings.
FMP's Financial Ratios TTM API supports this approach by updating valuation metrics in real time and providing up to five years of ratio history. With your API key, you can retrieve metrics such as P/E, P/B, and Gross Profit Margin across long enough lookback windows to measure direction, magnitude, and persistence of drift.
Building the Valuation Drift Scorecard
The Valuation Drift Scorecard provides a simple structure for quantifying how a company's valuation changes relative to its sector. It requires three components:
- A sector benchmark (e.g., Technology sector median P/E)
- A comparable company's valuation history (e.g., Apple's P/E over the same period)
- A method for calculating the premium/discount and how it evolves over time
Tracking drift across multiple valuation metrics (P/E, EV/EBITDA, P/B) gives a fuller view of how sentiment and fundamentals interact.
Case Study: Tracking P/E Drift in the Technology Sector
Let's illustrate the methodology by tracking the Price-to-Earnings (P/E) multiple for Apple (AAPL) against the Technology sector median for a 5-year comparison.
Action Steps:
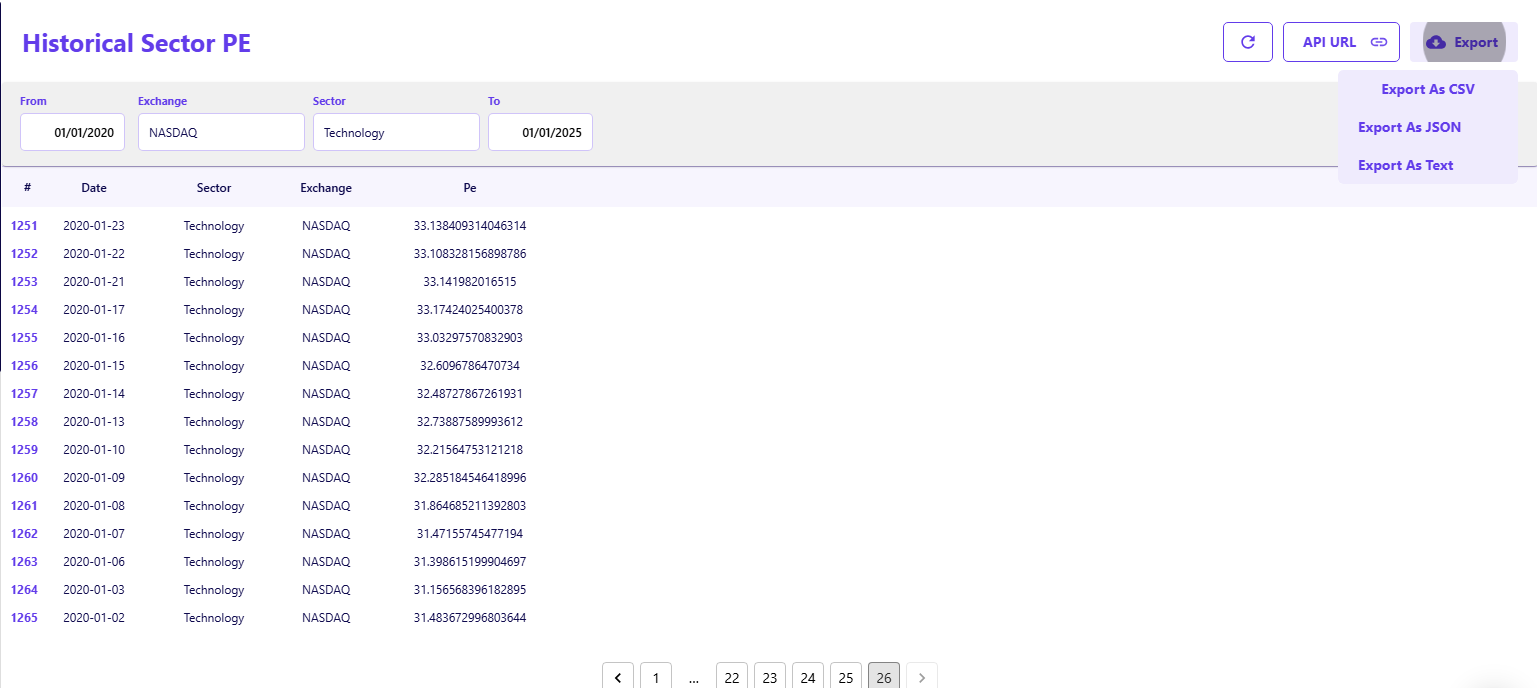
- Establish the Benchmark: Use the FMP Historical Sector Performance API to retrieve 5-year data for the Technology sector. Compute the sector's historical median P/E this is your neutral benchmark.
- Data Processing Detail: This API provides statistics like the median P/E. Since you need to compute your own risk-adjusted median, export the raw API response into a format your models can handle, such as JSON or CSV. This step provides the necessary baseline against which every stock will be measured.
- Retrieve Company Data: Use the FMP Financial Ratios API to retrieve the corresponding 5 years of P/E data for Apple.
The table below shows Apple's valuation data relative to the Technology sector between 2024 and 2025. These ratios are based on trailing twelve-month data for the Technology sector as of Q4 2025.
|
Metric |
5-Year Tech Median P/E |
AAPL P/E (1 Year Ago - 2024) |
AAPL P/E (Current - 2025) |
|
P/E Multiple |
45.54x |
37.28x |
34.09x |
|
Median Gap (Premium/Discount) |
N/A |
-8.26x (Discount) |
-11.45x (Discount) |
|
Drift Direction |
N/A |
N/A |
Negative Drift |
Analyst Interpretation
Apple trades at a consistent discount to the sector median. The discount widened by 3.19 P/E points from 2024 to 2025, indicating a negative valuation drift. If your internal estimates for earnings and cash flow haven't changed materially, the expanding discount suggests market sentiment is weakening relative to peers.
This widening gap is the drift signal — a potential catalyst for reviewing thesis assumptions, competitive dynamics, or timing for position sizing.
How to Interpret Valuation Drift
Drift signals become meaningful when you evaluate the direction, magnitude, and persistence of the movement.
Improving Drift (Narrowing Discount or Expanding Premium)
Indicates strengthening sentiment. This may support increasing exposure or revisiting valuation assumptions for relative value comparison.
Stable Drift
Suggests the company's relative valuation is consistent. The signal shifts from valuation concerns to operational or strategic factors.
Deteriorating Drift (Widening Discount or Shrinking Premium)
Indicates weakening sentiment or perceived risk. Persistent negative drift across multiple quarters may signal a structural re-rating.
Persistence Matters
Persistence is what turns a movement into a signal. A single-period change may reflect noise; drift that continues across three or more periods is more likely a structural re-rating. Use the multi-year ratio history from the API to confirm whether the change holds over time rather than reacting to isolated shifts.
Use Cases: Peer Tracking and Mispricing Alerts
Valuation drift fits naturally into several core analytical workflows. Because it tracks how multiples evolve relative to peers, it helps clarify sentiment shifts, competitive divergence, and potential pricing inefficiencies that aren't visible in static ratios.
Peer Benchmarking
Track how valuation changes relative to sector medians or specific peers. If a competitor's drift improves while yours deteriorates, the market is signaling a sentiment divergence worth investigating.
Identifying Mispricing
When evaluating mispricing, focus on valuation changes that are both substantial and persistent. These movements often indicate where market perception has moved ahead of fundamentals or lagged behind them.
- Strong Positive Drift may identify overextension or over-optimism relative to fundamentals.
- Strong Negative Drift paired with stable fundamentals may signal a potential value opportunity.
This helps you frame re-rating trends, detect divergence between price and fundamentals, and refine entry or exit timing.
The Edge of Dynamic Valuation
Static valuation metrics only show where a company stood at the last reporting date. Valuation drift shows where expectations are moving now. By tracking how a company's premium or discount to its sector median changes over time — and confirming whether those shifts persist — you get a forward view of sentiment that traditional ratios can't provide.
Using FMP's Financial Ratios API alongside sector-level benchmarks gives you a consistent way to monitor these changes in real time. This helps you identify when re-rating trends are forming, when sentiment is diverging from fundamentals, and where potential mispricing may be developing. Drift turns valuation from a static snapshot into a dynamic signal you can use across portfolio reviews, timing decisions, and peer analysis.
Next Steps
To build on this framework, explore how valuation drift pairs with technical momentum signals. Combining fundamentals with technical indicators often surfaces inflection points earlier and strengthens conviction around re-rating trends. For a deeper look at how to integrate these signals, continue to the next article in this series on combining fundamentals and technicals within a unified market insight workflow.
FAQs: Valuation Drift and Real-Time Financial Data
What is the primary difference between volatility and valuation drift?
Volatility is the measure of short-term price fluctuations. Valuation drift is the measure of the sustained, directional change in a valuation multiple (like P/E) relative to its peer benchmark over a medium-to-long term. Drift indicates a structural re-rating; volatility is market noise.
How do you identify the best peer group for a Valuation Drift Scorecard?
The most effective peer group uses the FMP Historical Sector Performance API data, focusing on the narrowest applicable industry or sub-sector (e.g., using 'Semiconductor Equipment' instead of broad 'Technology'). A smaller, relevant peer set ensures the calculated median is a true competitive benchmark.
What are the best stock market APIs for financial professionals focused on valuation?
For professionals focused on valuation, APIs that deliver rich, standardized financial statement data and computed metrics are essential. The FMP Financial Ratios API is highly valued for its depth in P/E, P/B, and liquidity ratios, all derived directly from company filings.
How often should I monitor the Valuation Drift Scorecard?
For most liquid, publicly traded companies, you should monitor the scorecard at least weekly, aligning with the release of new price data. For high-volatility sectors or during earnings season, daily monitoring is recommended to catch rapid, significant shifts.
Does valuation drift account for macroeconomic changes?
Yes, implicitly. If the Federal Reserve raises interest rates, it generally compresses multiples across all sectors. The drift scorecard captures this by measuring a stock's P/E relative to its sector median. If the sector median drops, but the stock's P/E drops more (expanding negative drift), the macro effect is amplified by a company-specific concern.
Can valuation drift predict future earnings surprises?
Valuation drift often anticipates earnings changes. A sustained, positive drift (expanding premium) signals that the market is already pricing in better-than-expected future earnings, making a positive Post-Earnings Announcement Drift (PEAD) less likely, as the good news is already "in the price."

MicroStrategy Incorporated (NASDAQ:MSTR) Earnings Preview and Bitcoin Investment Strategy
MicroStrategy Incorporated (NASDAQ:MSTR) is a prominent business intelligence company known for its software solutions a...

WACC vs ROIC: Evaluating Capital Efficiency and Value Creation
Introduction In corporate finance, assessing how effectively a company utilizes its capital is crucial. Two key metri...

BofA Sees AI Capex Boom in 2025, Backs Nvidia and Broadcom
Bank of America analysts reiterated a bullish outlook on data center and artificial intelligence capital expenditures fo...

