FMP
How to Use VWAP with 1-Hour Stock Chart API for Defining the Strength of the Trend.
Jul 17, 2025
If you're a trader who wants to understand the real average price a stock is trading at during the day, you'll love the VWAP indicator. In this article, I'll show you how to calculate VWAP using hourly stock data from the Financial Modeling Prep (FMP) API. I'll also explain how you can use it to forecast the strength of the trend.
What is VWAP?
VWAP stands for Volume Weighted Average Price. It tells you the average price a stock has traded at, based on both price and volume. Unlike a simple average, VWAP takes into account how much of the stock was traded at each price point.
This makes it super helpful for:
-
Finding the fair price of a stock.
-
Spotting if a stock is overpriced or underpriced during the day.
-
Helping big investors know if they got a good deal on a trade.
- Defining the strength of the trend.
How to Get Hourly Stock Prices from the API
You can use the FMP 1-Hour Stock Chart API Endpoint to get open, high, low, close, and volume for each hour. Here's what the API URL looks like:
-
Replace AAPL with any stock ticker.
-
Replace custom_api_key with your actual API key from FMP.
The response provides you JSON data that looks like this:
{
How to Calculate VWAP Using Hourly Data
To calculate VWAP, use this formula:
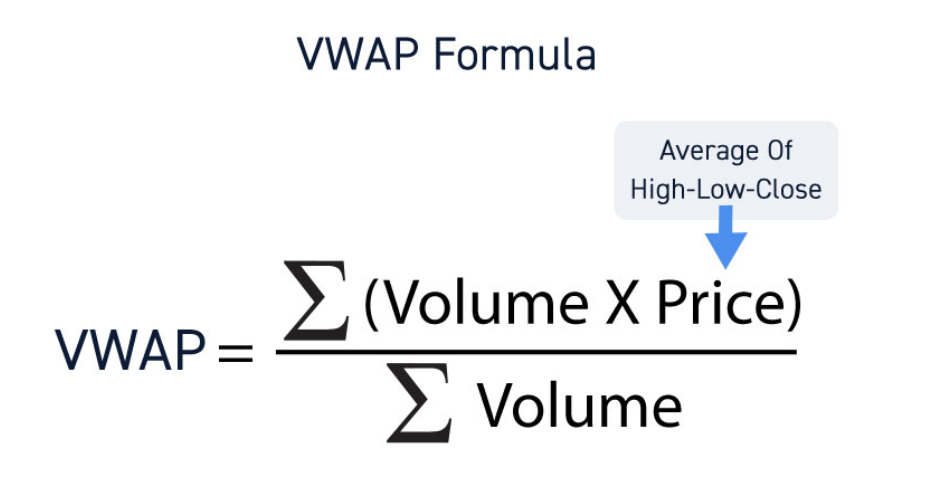
Where:
-
Price = (High + Low + Close) ÷ 3
-
Multiply Typical Price by Volume for each hour
-
Add up all those values and divide by the total volume
Example:
Let's say you have this data for three hours:
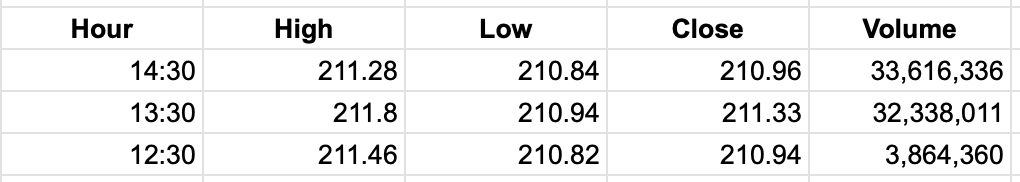
Now:
-
Calculate Typical Price for each hour:
-
(211.28 + 210.84 + 210.96) ÷ 3 ≈ 211.03
-
(211.80 + 210.94 + 211.33) ÷ 3 ≈ 211.36
-
(211.46 + 210.82 + 210.94) ÷ 3 ≈ 211.07
-
-
Multiply by volume:
-
211.03 × 33,616,336 = 7,096,025,672
-
211.36 × 32,338,011 = 6,835,828,890
-
211.07 × 3,864,360 = 815,965,051
-
-
Add them up:
-
Total (Price × Volume) = 14,747,819,613
-
Total Volume = 69,818,707
-
-
Divide:
-
VWAP = 14,747,819,613 ÷ 69,818,707 = 211.2
-
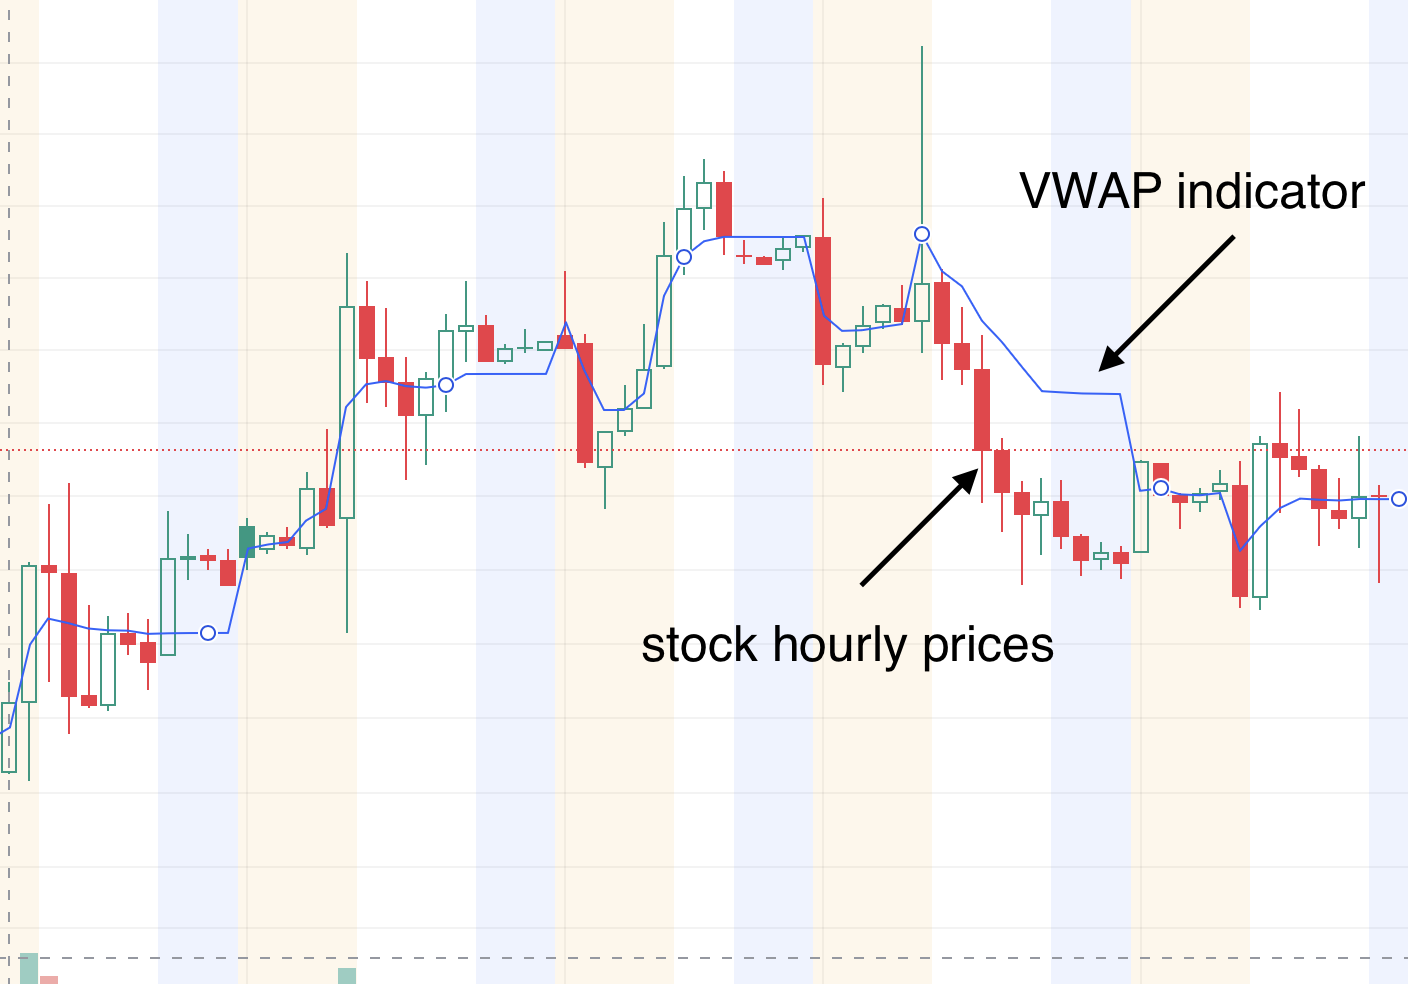
Calculate in a similar way for every hour. You can also plot your findings on a graph, as shown on the below image. I will explain below how to use your findings.
Why Traders Use VWAP
Here's how VWAP helps traders every day:
1. Buy Low, Sell High
-
If the stock is trading below VWAP, it may be undervalued.
-
If it's above VWAP, it may be overvalued.
2. Better Timing
-
Use VWAP as a support or resistance line.
-
If price bounces off VWAP, it might be time to enter or exit a trade.
3. Stay on the Right Side
- Big traders (like hedge funds) use VWAP to place trades. When the stock price crosses the VWAP upwards, it means that a more confident upside trend is starting. Conversely, when the stock is crossing the VWAP downwards, it means that the downside pressure is high and the downside trend is strong.
Using VWAP with hourly stock data from the FMP API is a great way to trade smarter. It's simple to calculate, and it gives powerful insights into how a stock is really performing during the day. You can use the 1 Hour Interval Stock Chart API Endpoint to fetch data to your custom app and automate the VWAP building process. You can also import your findings in Google Sheets or use them in your browser to build it manually.

MicroStrategy Incorporated (NASDAQ:MSTR) Earnings Preview and Bitcoin Investment Strategy
MicroStrategy Incorporated (NASDAQ:MSTR) is a prominent business intelligence company known for its software solutions a...

WACC vs ROIC: Evaluating Capital Efficiency and Value Creation
Introduction In corporate finance, assessing how effectively a company utilizes its capital is crucial. Two key metri...

BofA Sees AI Capex Boom in 2025, Backs Nvidia and Broadcom
Bank of America analysts reiterated a bullish outlook on data center and artificial intelligence capital expenditures fo...

