FMP
How to monitor your stocks' target prices change and undertake appropriate actions depending on the stock's fair value change.
Nov 26, 2024 2:33 PM - Sanzhi Kobzhan
Image credit: stock target price change
Stock target price represents a valuable indication of companies' fair value based on companies' financials and peer comparisons. If you know the stock target price, you can understand analyst and traders' sentiment towards this stock and undertake appropriate actions depending on the stock target price change. In this article, let's consider how you can monitor stock target prices, how you can extract the data, and how you can improve your trading strategy by using target prices change data.
I've already explained what the stock target price is and how to calculate it using different valuation models. You can use the DDM model, the DCF model, or multiplicators model for calculating the stock fair value (target price). Those models take time to compute, and not everyone has this time, especially when you need to undertake quick trading decisions. Now let's see how you can extract data quickly and see target prices assigned by different analysts.
Stock target price extraction.
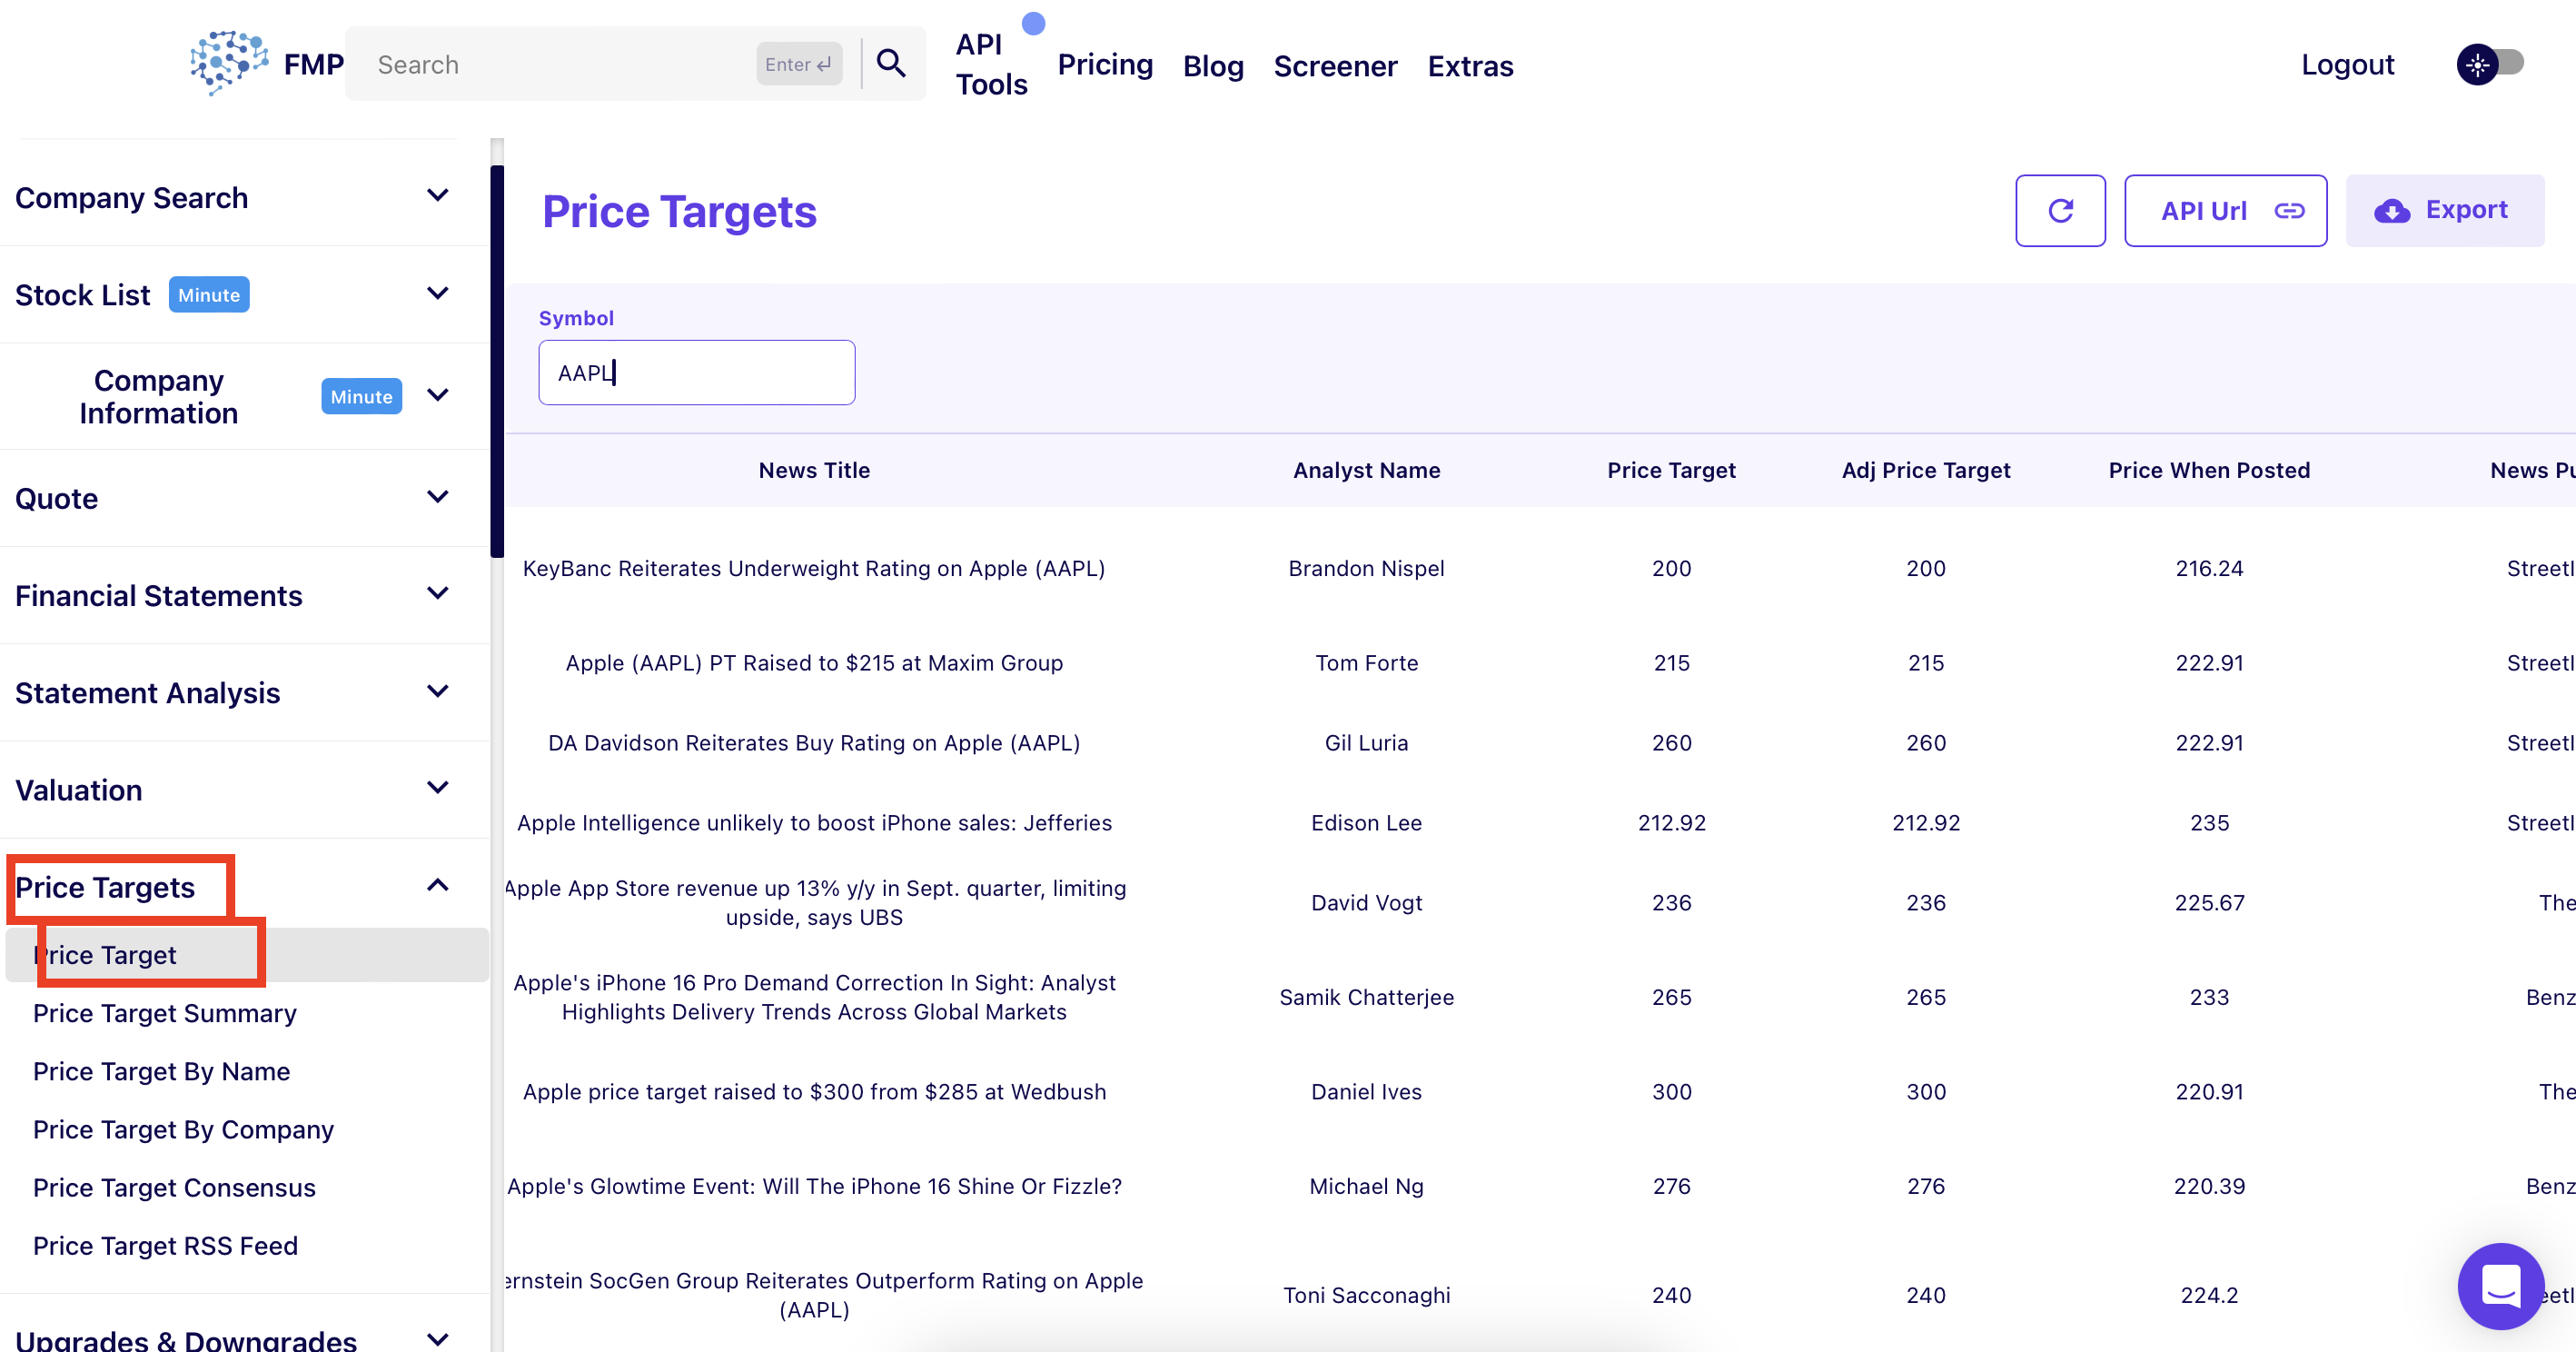
First, you need to register with Financial Modeling Prep to use the data. After registering, you can head to the Playground and on the left side panel, choose Price Targets, then Price Target as shown in the picture below.

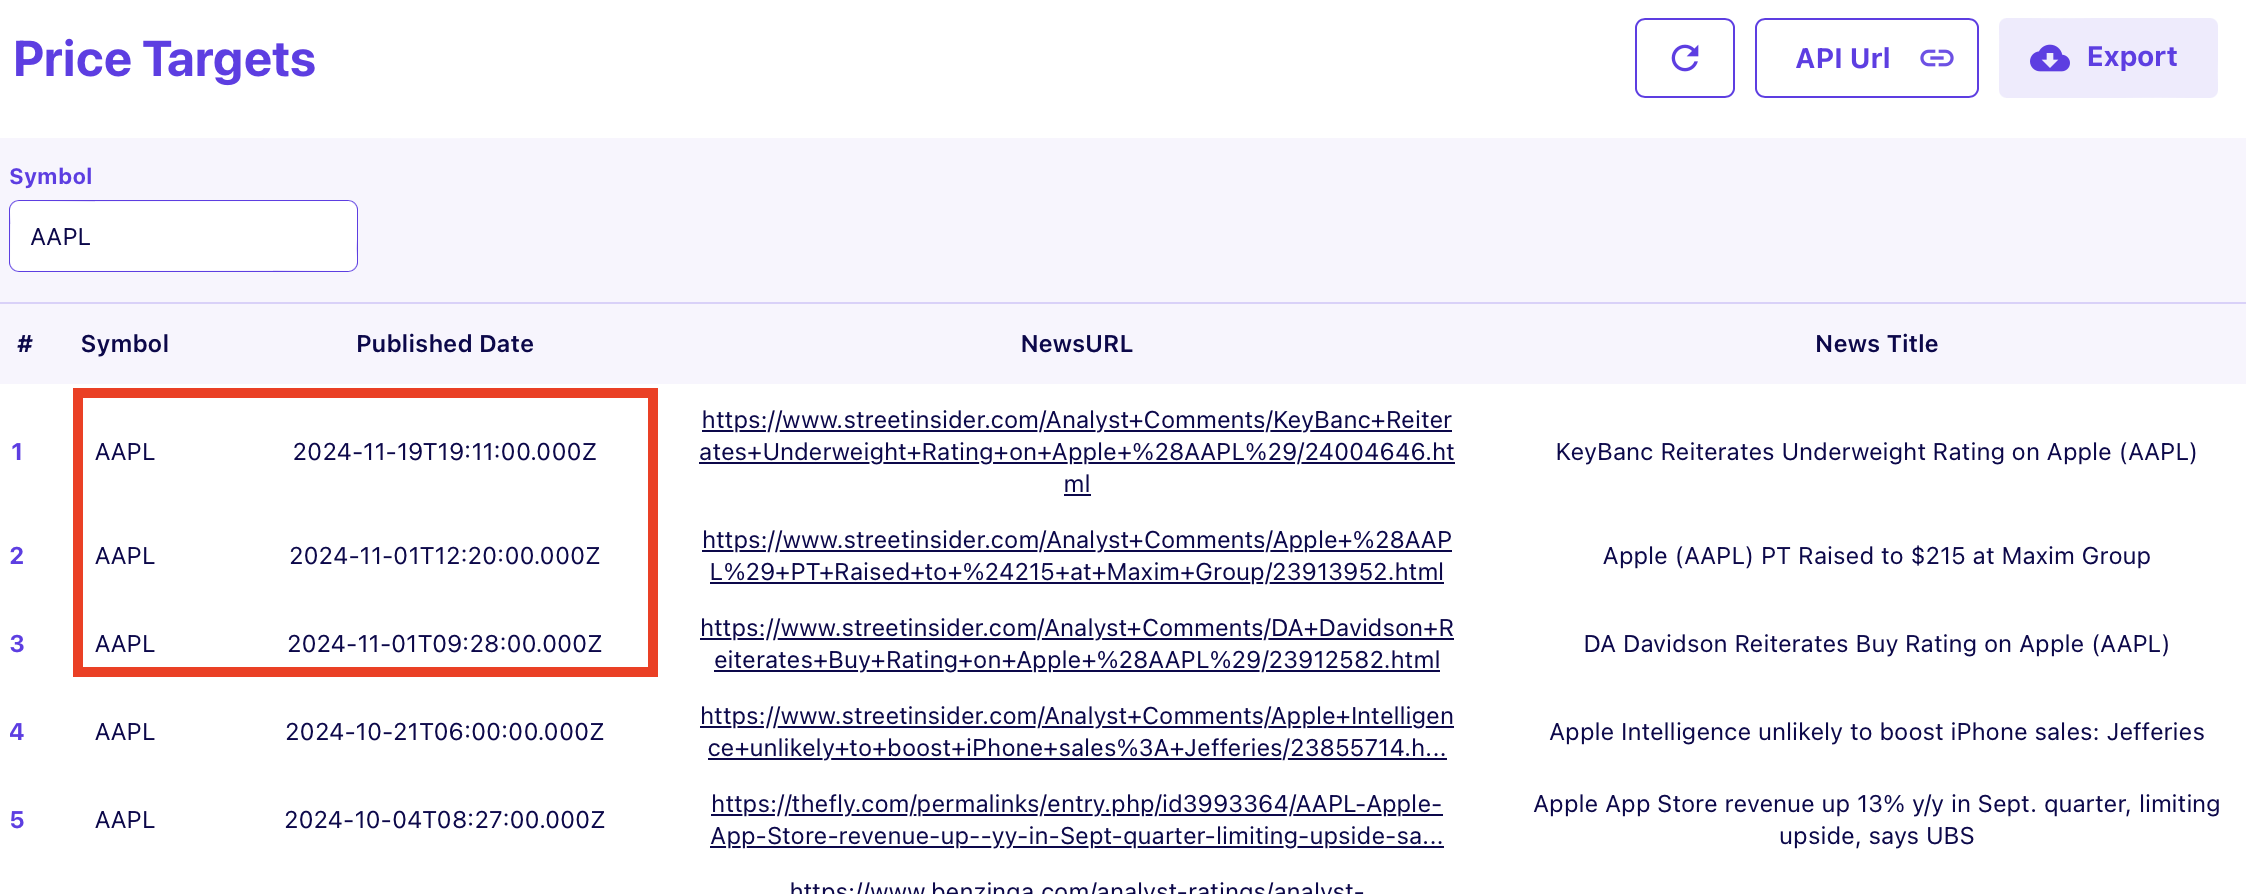
After choosing the Price Target, you will be able to see recent target price changes, the stock ticker, news URL, analyst name, and the financial institution name where this analyst works. You can also see the price target assigned by the analyst. If you are looking for some specific stock, you can search it in the search panel by entering the stock ticker.
With this data, you can see stock target price changes and recent price changes. You can export this data to CSV, text, or JSON formats. Just hit the Export button at the top right corner and choose your exporting format.
If you are developing your custom application, you can use the Price Targets API endpoint and fetch data directly from the endpoint.
Now, after you know how to extract data, let's see how you can analyze it to improve your trading strategy.
Stock target price analysis.
Stock market price reacts directly to stock target prices change. When analysts increase their target prices, this often results in stock market price upside, because analysts are optimistic about the company's financials or have improved their assumptions. And when analysts decrease the stock target price, this may result in stock market price decline as analysts may not be that optimistic about the company's future financials. To do accurate analysis, first choose the stock that you want to analyze. Let's say that you are interested in AAPL share. Input the stock ticker in the search bar and hit enter.
To analyze stock properly, examine last target price changes. For example, with Apple stock (AAPL), you see three recent target price changes in November (I am writing this article in November and I examine price changes for the last month). Older price changes are not that relevant as they are not reflecting recent company changes, and maybe analysts are in the process of updating their targets; that's why I only take recent price targets as shown in the picture below.

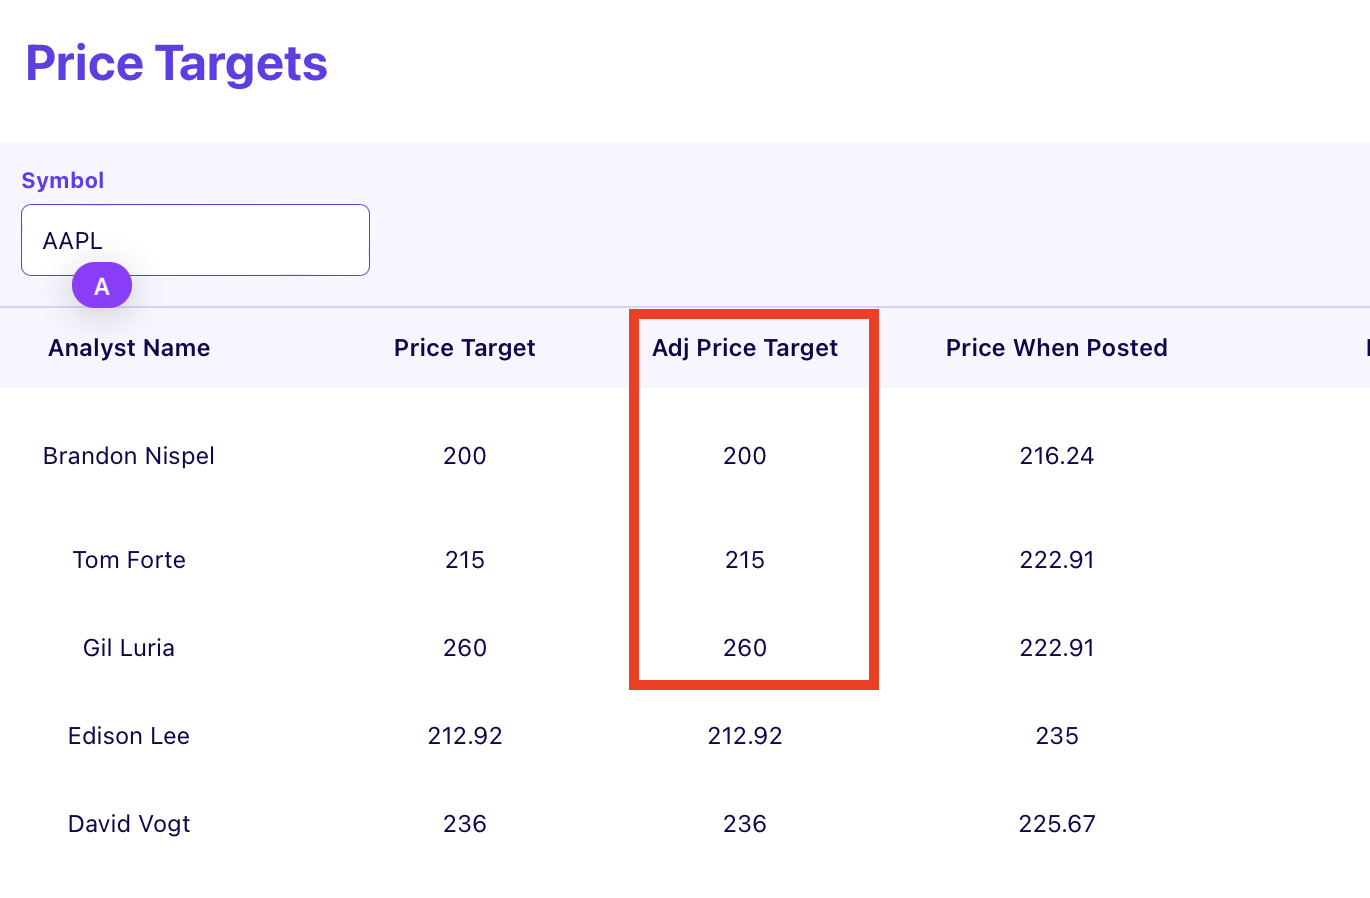
The last step is to take the average of the price targets; in our case, it is three last price targets calculated by different investment analysts as shown in the picture below, and then to calculate the average target price of those three investment analysts, which is (260 + 215 + 200) / 3 to calculate the average. And we get 225, which will be our fresh consensus target price. By the time of writing this article, the Apple market price is 234.64, which implies a 4.28% growth potential based on the most recent data. This means that AAPL shares are almost fairly valued and it may be trading flat. So, traders may consider searching for other stocks that have higher growth potential.

This is how you can analyze the stock by using a simple API endpoint or by using the Financial Modeling Prep playground. But please don't rely only on stock target prices and do in-depth research to have a wider investment view and not to miss some important points before taking investment decisions.
Other Blogs
Sep 10, 2024 7:33 AM - Parth Sanghvi
Best Alternatives to Yahoo Finance for Downloading Historical Stock Data
When it comes to downloading historical stock data, Yahoo Finance has been a popular choice for many. However, for those looking for more comprehensive, accurate, and flexible options, Financial Modeling Prep (FMP) offers a suite of powerful tools and services that stand out as superior alternatives...
Nov 8, 2024 5:30 AM - Sanzhi Kobzhan
Understanding Equity Valuation: When to Use DCF, DDM, and Price-Income (Multiplicators) Models
When it comes to investing in stocks, one of the key decisions an investor must make involves determining the intrinsic value of a company's shares. Equity valuation isn't just about numbers, it's an art mixed with science, aiming to predict future performance based on current and historical data. H...
Nov 22, 2024 5:08 AM - Parth Sanghvi
Fundamental Analysis: Principles, Types, and How to Use It
Fundamental analysis is one of the most essential tools for investors and analysts alike, helping them assess the intrinsic value of a stock, company, or even an entire market. It focuses on the financial health and economic position of a company, often using key data such as earnings, expenses, ass...