FMP
How to Get Stock Intraday Data with FMP APIs
Aug 28, 2025(Last modified: Nov 19, 2025)
Imagine receiving an instant alert the moment a stock's price spikes within the day - that's the power of intraday data. For developers building backend services or financial apps, intraday stock data is a goldmine for real-time analysis and alerts.
In this guide, we'll show how to get stock intraday data using Financial Modeling Prep (FMP) APIs, specifically focusing on FMP's 1-Minute Interval Stock Chart API. You'll learn to pull minute-by-minute price data, incorporate real-time price checks, and even filter stocks with a screener - all using efficient API calls. Let's dive in and supercharge your financial app with live data.
Why Intraday Stock Data Matters
Intraday stock data refers to the granular price and volume information recorded at short intervals (e.g. minutes) throughout the trading day. Unlike end-of-day summaries, intraday data captures every twist and turn of a stock's price within the day, enabling:
- Real-Time Decision Making. Traders and algorithms can react to market moves immediately, rather than waiting for end-of-day prices. For example, a day trader can spot a sudden volume spike at 11:15 AM and act on it.
- Technical Analysis: With minute-by-minute open, high, low, close (OHLC) data, you can plot detailed charts and apply indicators (moving averages, RSI, etc.) to detect patterns or short-term trends.
- Alerts & Risk Management: Intraday data allows setting alerts (e.g. notify if price drops 2% in 5 minutes) and managing risk through stop-loss or take-profit triggers in near real-time.
In short, intraday data is invaluable for active traders, quantitative analysts, and anyone building tools that require up-to-the-minute market information. FMP's APIs make accessing this data straightforward, as we'll see next.
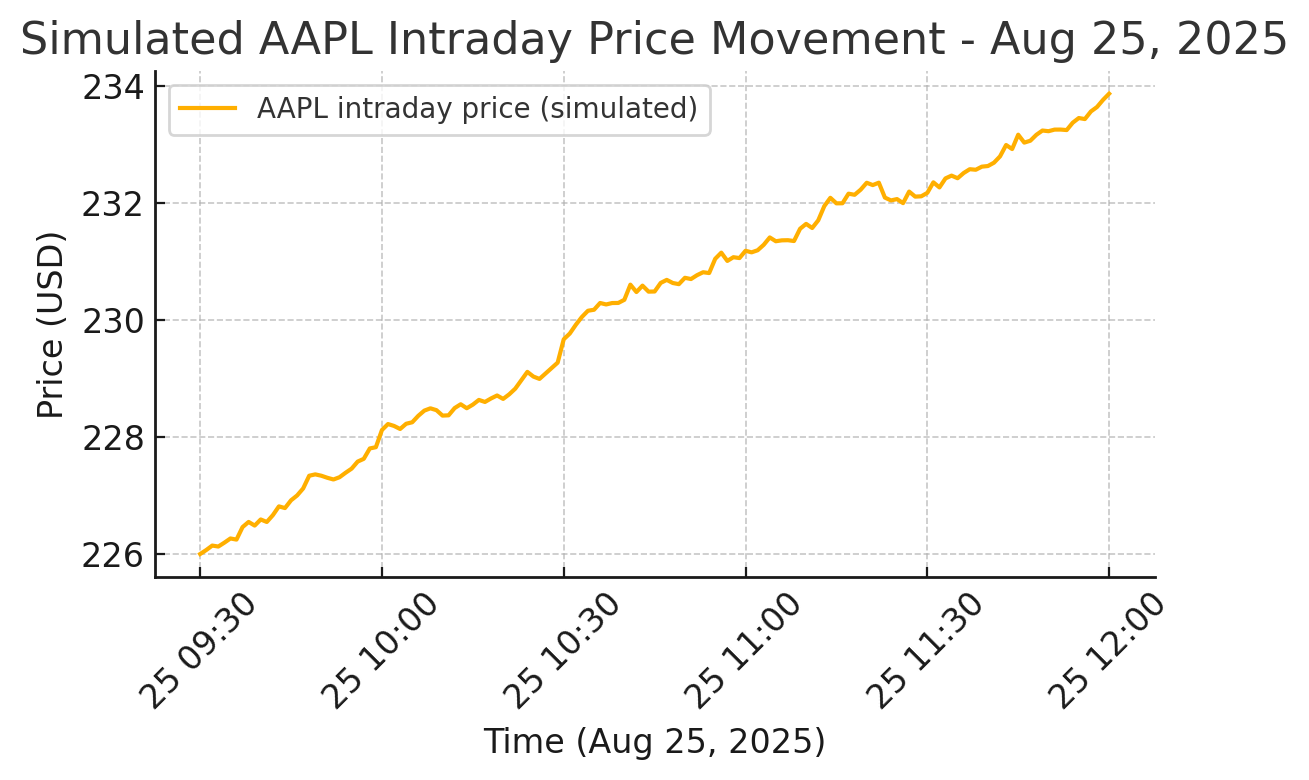
Example: A simulated intraday price chart for AAPL on Aug 25, 2025, showing minute-by-minute price movement. Intraday data provides granular insight into short-term stock trends
Using FMP's 1-Minute Interval Stock Chart API
FMP offers a dedicated 1-Minute Interval Stock Chart API that provides precise intraday price and volume data. This API returns each minute's open, high, low, close, and volume for a given stock symbol. It's designed for developers and analysts who need detailed intraday coverage - perfect for building live charts, backtesting intraday strategies, or triggering real-time alerts.
Key features of the 1-min intraday API include:
- Minute-by-Minute OHLCV Data. Get a JSON array of data points, each with timestamp (date), open, high, low, close prices, and volume for that minute.
- Real-Time Updates. During market hours, new minute data becomes available as trading progresses. You can retrieve real-time intraday data to stay updated on the latest tick.
- Historical Depth: You can request historical intraday data for specific date ranges (via from and to parameters). In fact, FMP allows accessing decades of intraday history (data goes back over 30 years in some cases)- incredibly useful for long-term intraday analysis or model training.
- Adjusted for Splits: No need to manually adjust old prices - intraday data is adjusted for stock splits by default, ensuring continuity in historical price series.
Endpoint and Example Request
The base endpoint for 1-minute data is:
https://financialmodelingprep.com/stable/historical-chart/1min?symbol=
For example, to fetch Apple's intraday data (1-min intervals) you would use:
https://financialmodelingprep.com/stable/historical-chart/1min?symbol=AAPL&apikey=YOUR_API_KEY
This request returns a JSON array, with the most recent minute's data first. A truncated example response looks like:
[
{
"date": "2025-08-25 11:40:00",
"open": 228.83,
"high": 228.865,
"low": 228.70,
"close": 228.75,
"volume": 69252
},
{
"date": "2025-08-25 11:39:00",
"open": 228.78,
"high": 228.8146,
"low": 228.6579,
"close": 228.8146,
"volume": 38256
},
...
]
Each object represents one minute of trading. In this snippet, at 11:39 the price opened at 228.78 and closed slightly higher at 228.81 on a volume of 38,256 shares.
Expert Tip: The API returns data in descending order (latest minute first). Be sure to reverse or sort by date if you need chronological order.
JavaScript Code Sample: Fetching Intraday Data
Let's walk through a simple JavaScript example that pulls intraday data and processes it. This could be part of a Node.js script or a front-end app (if CORS permits). Make sure you have your FMP API key ready.
const fetch = require('node-fetch');
const symbol = 'AAPL';
const apiKey = 'YOUR_API_KEY';
const url = `https://financialmodelingprep.com/stable/historical-chart/1min?symbol=${symbol}&apikey=${apiKey}`;
fetch(url)
.then(response => response.json())
.then(data => {
console.log(`Retrieved ${data.length} intraday records for ${symbol}.`);
if(data.length > 0) {
const latest = data[0];
console.log(`Latest price for ${symbol} at ${latest.date} = $${latest.close}`);
}
})
.catch(error => console.error('Error fetching intraday data:', error));
In this script, we use the 1-min interval API for AAPL. The response data will be an array of minute-bar objects. We log the count of records and the latest price. In a real application, you might iterate through data to compute indicators or check conditions (e.g., sudden price jumps) for alerts.
Output (sample):
Retrieved 391 intraday records for AAPL.
Latest price for AAPL at 2025-08-25 11:40:00 = $228.75
From here, you could use the intraday dataset to draw charts or trigger alerts. For instance, if you wanted to detect a rapid drop: iterate over the last 5 minutes in data and compare the prices - if the percentage drop exceeds your threshold, send a notification.
Analyzing Intraday Data for Alerts and Insights
Once you have the intraday data, what can you do with it? Here are a few ideas for backend developers and data app builders:
Real-Time Alerts.
Loop over new data points as they arrive (or poll the API every minute) and check conditions. For example, you can send a Slack or email alert if a stock's price surges more than 1% within 10 minutes, indicating unusual momentum.
Intraday Charts & Dashboard.
Visualize the data for users. You could plot a live candlestick or line chart updating throughout the day. Many FMP users integrate the intraday API with charting libraries to build dashboards showing live stock movements.
Technical Indicator Calculations.
Compute indicators like VWAP (Volume-Weighted Average Price) or RSI on intraday data for trading signals. For instance, calculating a 20-minute moving average and comparing it to the current price can help generate a buy/sell signal for a short-term strategy.
Historical Intraday Backtesting.
Because FMP provides extensive historical intraday data, you can backtest trading strategies on past minute-level data. For example, test how a strategy based on intraday mean reversion or breakouts would have performed over the last year of 1-minute data.
Combining with Fundamentals or News.
Intraday data is even more powerful when combined with other information. Imagine checking intraday price reaction when a breaking news headline hits — your app could flag stocks that suddenly spike in volume, which might indicate news-driven activity.
When analyzing intraday data, always consider the time zone and market session. FMP's intraday timestamps correspond to the exchange's local time zone (e.g. NYSE data is in Eastern Time).
Real-Time Stock Price API for Instant Updates
While the 1-min interval API is great for detailed series data, sometimes you just need the latest stock price in real time. For that, FMP provides a Real-Time Stock Price API (often called the Quote API). This is a lightning-fast endpoint returning the current price (and a few key details). It's perfect for quick price checks or updating watchlists.
- Endpoint: https://financialmodelingprep.com/stable/quote?symbol=AAPL&apikey=YOUR_API_KEY - this returns a JSON array with the stock's quote data (including current price, change, day volume, etc.).
- Lightweight Response: FMP even offers a “quote-short” variant for an ultra-lean response containing only the essential fields like price and volume. If all you need is a single number (the price), this is ideal for minimizing latency and data usage.
- Real-Time Accuracy: The quote API provides the latest trading price in real time (no significant delay). It also updates during extended hours if applicable. For instance, FMP's real-time API will reflect pre-market moves early in the morning, helping you catch gaps or news reactions.
Example: Suppose you want to incorporate a live price check before executing an intraday strategy. You could call the quote API for a stock right now to ensure its last price meets your criteria.
Here's a quick illustration using JavaScript:
fetch(`https://financialmodelingprep.com/api/v3/quote-short/AAPL?apikey=${apiKey}`)
.then(res => res.json())
.then(data => {
const price = data[0]?.price;
console.log(`AAPL current price: $${price}`);
});
This returns something like [{ "symbol": "AAPL", "price": 233.27, "volume": 53123456 }]. With one quick call, we have Apple's live price. You can imagine using this to, say, check a condition (“if price > X then ...”) in your alerting logic without pulling the full intraday series each time.
Finding Stocks to Monitor with the Screener API
Now that you can fetch intraday data and live quotes, a natural question is which stocks to track. Hard-coding symbols is fine, but FMP offers a powerful Stock Screener API that lets you dynamically find stocks meeting certain criteria. This is a great way to discover candidates for intraday monitoring (for example, high-volume movers or stocks within a specific sector).
What is the Screener API?
It's an endpoint where you specify filters like market capitalization, volume, price range, sector, etc., and get back a list of symbols matching those filters. Essentially, it's a programmable stock screen at your fingertips.
Example Use Cases:
- High Volume Gainers: Use the screener to find stocks with volumeMoreThan a threshold and changePercentMoreThan some value, to catch active movers.
- Tech Stocks over $1B: Filter by sector=Technology&marketCapMoreThan=1000000000 to get a list of sizable tech companies, then pull intraday data for each to analyze intraday trends.
- Low-volatility Large Caps: Filter by marketCapMoreThan=10000000000&betaLowerThan=1 to find large companies with low beta (i.e., relatively stable stocks) -- useful if you want to monitor steady movers.
How to use: The screener endpoint is:
https://financialmodelingprep.com/stable/company-screener?
You append any criteria as query params. For instance, to get all large-cap stocks with high trading volume:
/company-screener?marketCapMoreThan=10000000000&volumeMoreThan=5000000&apikey=YOUR_API_KEY
This might return a list of heavy hitters. In an example from an FMP guide, using marketCapMoreThan=10000000000&volumeMoreThan=50000 returned “a list of large, actively traded companies” — exactly the kind of stable, liquid stocks you might want to focus on.
In practice, you'll want to integrate the Screener API into your workflow like so:
Step 1: Initial Screening.
Call the screener in the morning (or periodically) to get a fresh list of symbols meeting your conditions (e.g., top gainers, or stocks in a certain sector).
Step 2: Data Retrieval.
Loop through those symbols and fetch intraday data for each using the 1-min API.
Step 3: Monitoring/Alerts.
Apply your intraday analysis or alert conditions to each dataset. For example, out of the screened list, identify which stocks have unusual volume spikes or price breakouts in the intraday data.
Step 4: Repeat or Adjust.
You can re-run the screener intraday as well to refine your watchlist as the trading day evolves.
The Stock Screener API is extremely flexible and can significantly automate your stock selection process. It essentially ensures your intraday monitoring is dynamic - you're always looking at relevant symbols, not just a fixed list.
Next Steps
Leveraging FMP's intraday and real-time APIs, backend developers and data-driven traders can build robust systems for live market analysis. We've seen how the 1-Minute Interval Stock Chart API provides granular OHLC data perfect for charts and technical analysis, while the Real-Time Stock Price API gives instant price snapshots ideal for triggers and alerts. We also explored the Stock Screener API to intelligently pick which stocks to focus on, so your app always watches the right tickers.
Grab your API key from FMP and start pulling some data! Try plotting an intraday chart for a stock you follow, or set up a test alert when a stock's price moves X% in Y minutes. You can also explore FMP's documentation for related datasets - for example, check out the 5-Minute or 15-Minute interval APIs if 1-minute granularity is too fine, or the multitude of fundamental and market data endpoints to enrich your analysis.
FAQs
How often is the 1-min intraday data updated?
The 1-minute interval API provides a new data point for each minute of the trading session. During market hours, you'll see updates in near real-time - essentially, right after each one-minute candle closes. This makes it suitable for live monitoring and very short-term analysis.
Is the intraday data adjusted for stock splits or dividends?
Yes - FMP's intraday ‘close' prices are adjusted for stock splits by default. That means if a company undergoes a split, historical intraday prices are retroactively adjusted to maintain consistency. However, dividend adjustments are not applied to the price (since dividends don't typically affect intraday price scales). For dividend-adjusted series, FMP provides separate endpoints (e.g., an adjusted price chart API). In short, you don't have to manually adjust for splits when using the intraday API.
Do I need a premium plan to use intraday and real-time APIs?
FMP offers both free and paid plans. Free plan users can access intraday and real-time endpoints but may be limited in the number of requests per minute and the amount of historical data returned. Premium plans unlock full history (all the way back) and higher rate limits, which is essential if you're pulling big datasets or monitoring many symbols in real time.
Where can I find more documentation or support for FMP APIs?
The FMP Developer Documentation is the best place to start. It contains reference pages for each API endpoint (such as the 1-min chart API, quote API, screener API, etc.) with example calls and parameter details. You'll also find an API Explorer tool on the site where you can interactively test endpoints.

MicroStrategy Incorporated (NASDAQ:MSTR) Earnings Preview and Bitcoin Investment Strategy
MicroStrategy Incorporated (NASDAQ:MSTR) is a prominent business intelligence company known for its software solutions a...

WACC vs ROIC: Evaluating Capital Efficiency and Value Creation
Introduction In corporate finance, assessing how effectively a company utilizes its capital is crucial. Two key metri...

BofA Sees AI Capex Boom in 2025, Backs Nvidia and Broadcom
Bank of America analysts reiterated a bullish outlook on data center and artificial intelligence capital expenditures fo...

