FMP
How to find great undervalued stocks with amazing growth potential using Google Sheets and Financial Modeling Prep endpoints.
Dec 6, 2024 1:34 PM - Sanzhi Kobzhan
Image credit: stock selection. how to find stocks
Stock selection is a very important process, as correct stock selection together with the right asset allocation can bring you positive return over the longer term. In this article let's focus on stock selection and how to choose great stocks with amazing growth potential.
A lot of investment analysts and traders use different stock screeners for stock selection. Unfortunately, a lot of them are very complicated and provide confusing screening options and it is not easy to navigate for beginner traders. Let me help you in this process and highlight some of the important filtering options and ratios you should focus on to find great stocks. For this, we will be using the Financial Modeling Prep data points to extract important data and Google Sheets. We will build our own stock selection tool and then will be able to pick the best share from the filtered options.
Extracting stock market data.
The first step in our process is to obtain your custom API key, register with FMP, and connect Google Sheets to FMP to extract data. After connecting FMP with Google Sheets, navigate to the empty cell inside Google Sheets and use this formula:
=fmpStockScreener(10,”nyse”,"US",,,1000000000,,,,,1,,,,,,,true,)
Now let me explain what those parameters mean:
- The 10 is the number of records to be fetched (in the below example, I instruct FMP to extract 10 stock tickers),
- NYSE is the exchange we will be fetching our data from,
- US is the country where those stocks are trading,
- 1000000000 is the market cap. For example, now as of 6 Dec 2024, larger caps look overvalued and there are a lot of interesting investment ideas among smaller and mid caps as they look undervalued, that's why we can choose smaller/mid market cap stocks. Or you can try searching among larger caps too, as these stocks tend to be more stable and less volatile.
- 1 is Beta which shows stock volatility; a Beta of 2, for example, indicates that your selected stock is 2 times more volatile than the market (S&P 500 in our case). That's why we choose 1 to indicate that we are searching for a stock with Beta less than 1.
- And the true indicates that we are searching for actively trading stocks.
After applying those filters, you will have stocks fetched as shown in the table below.

The next step is to build a simple table as shown in the table below:

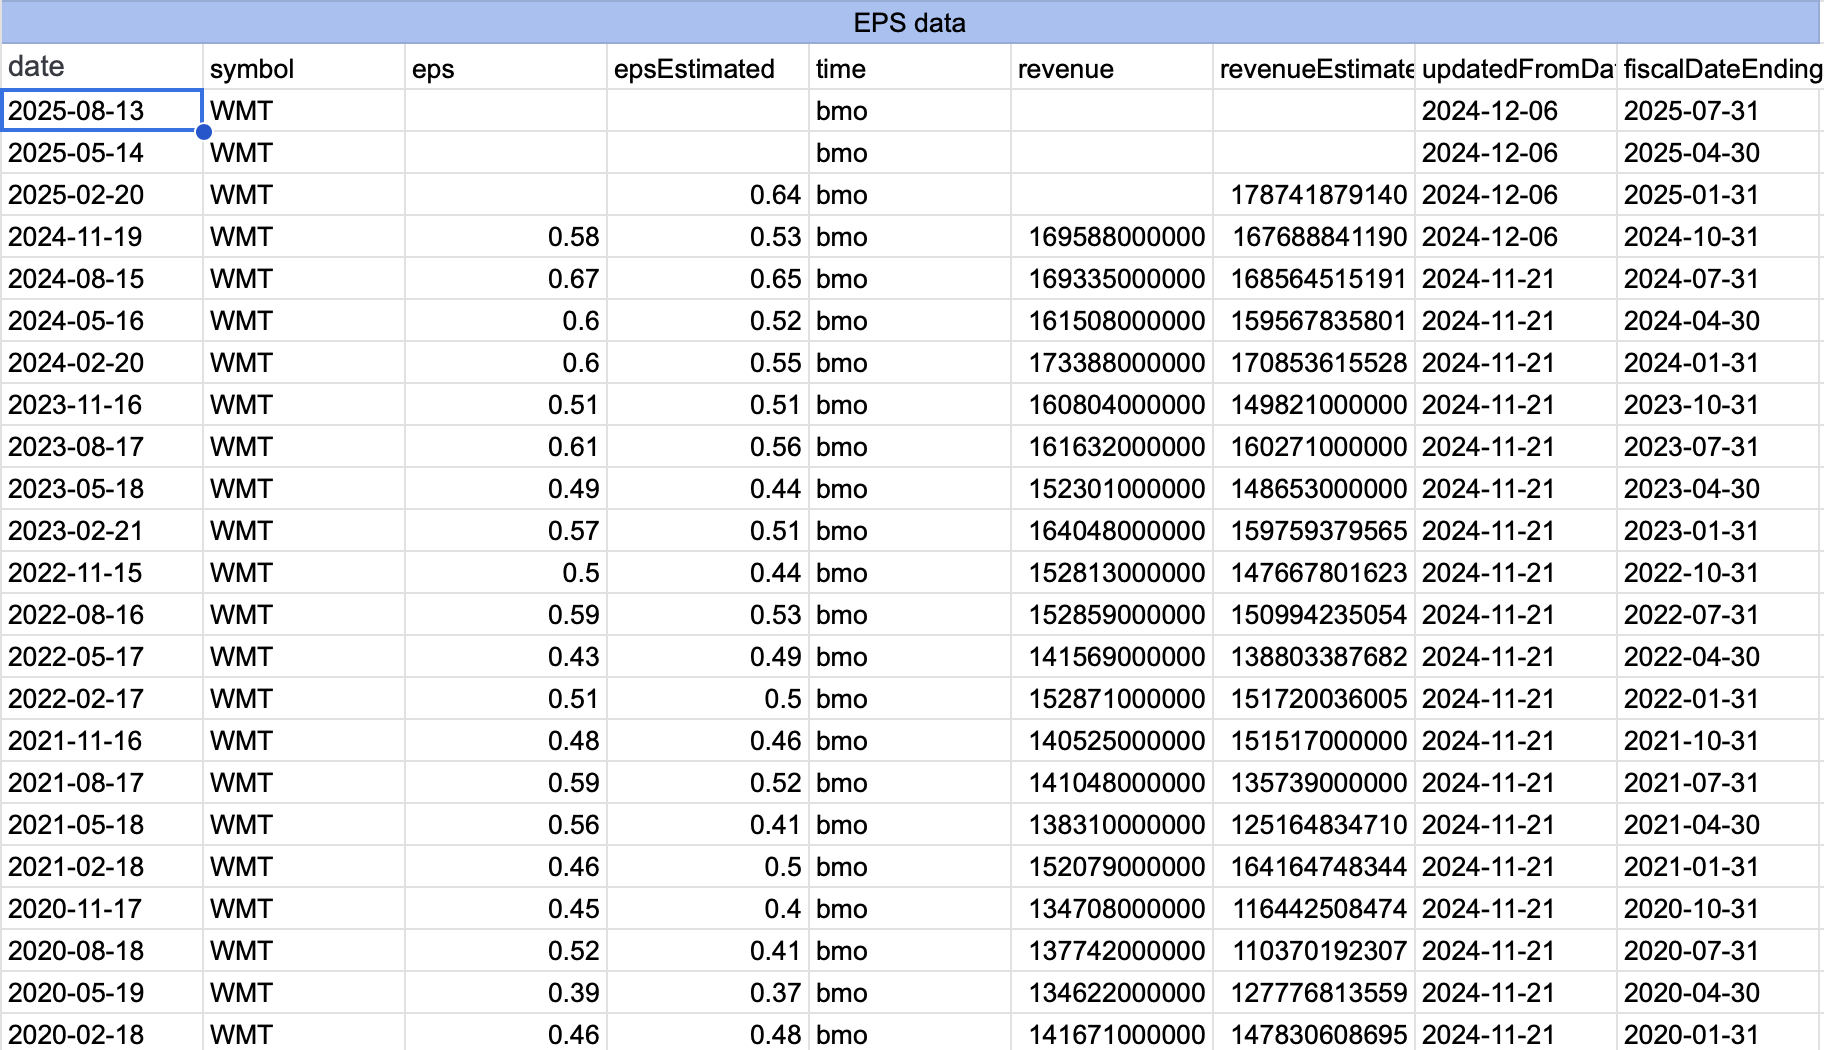
I am taking the Walmart (WMT) share as an example (we took it from out screener). First, let's fill in the table, and then I will explain what those things inside the table mean and what you should look for. First thing you need to extract is EPS data. Use this FMP formula for this:
=fmpHistoricalEarningCalendar(B2,30)
Where B2 is the stock ticker taken from the table; in our example, it's WMT share, and 30 is the number of periods we fetch. EPS shows quarterly data, so we need 30 quarters to see the last 6 years and more in our observations. After applying the formula in an empty cell, your table with EPS data should look like this:

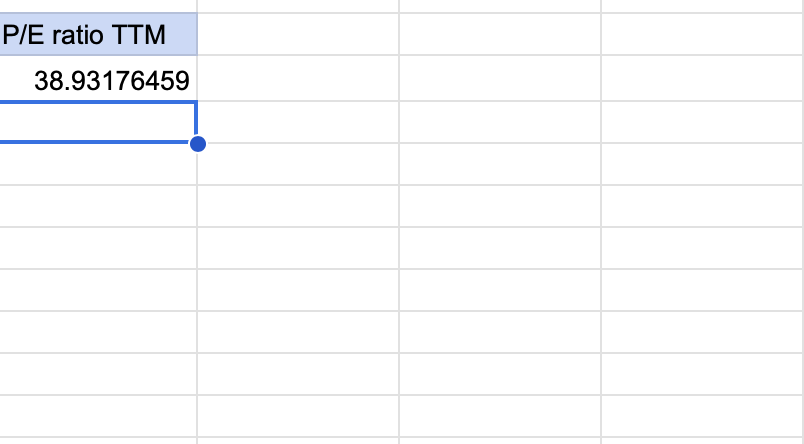
The next step is to extract the P/E ratio TTM; TTM stands for trailing twelve months. Use the following FMP formula for this, which you should input in an empty cell:
=fmpRatiosTtm(B2,”peRatioTTM”)
Where B2 is the cell number with our WMT ticker. And peRatioTTM is the name of the ratio that we need to extract; if you don't specify it, you will get a lot of financial ratios which we don't need for our analysis. This is what you get after you apply the formula:

The next step is to fill in the table.
Undertaking calculations.
For “EPS growth over the past 5 Y,” I take EPS for the first year in our observations and compare it to the last EPS, extracting the percentage difference; in our case, the percentage difference formula is (0.67 - 0.36) / 0.36, and we get 86.11% EPS growth rate over a five-year period.
P/E ratio is copied from the table that we fetched using the =fmpRatiosTtm(B2,”peRatioTTM”) formula.
And to calculate the PEG, you need to divide the P/E ratio by the EPS growth rate that we calculated earlier. In our example, the PEG is 45.
Interpreting the result.
Based on the result that we got, WMT is not the stock that we are looking for. We are looking for companies with EPS growth higher than 15%, which WMT has, and Beta below 1, but the PEG ratio is too high; ideally, we need a company with a PEG below 1, this would mean that the company is undervalued and P/E still has great space for upside given high EPS growth rate, but in case of WMT, P/E ratio is already high, which means that you can try finding other stocks with a smaller PEG ratio. Now you can repeat the above process. You don't have to build your stock screener again since you already have it, but you can change the stock and try making above calculations for another ticker. If you won't find stocks with low PEG and good EPS growth rate, you can change the market cap parameter inside the screener and try undertaking the same analysis for smaller cap stocks, or you can increase the number of fetched stocks from 10 to say 20.
What's next?
After you found shares that satisfy our search requirements, it's time to undertake equity valuation to see what growth potential our stock has. You can use one of the valuation models; the DCF model, the DDM model, or the price-income model. And if your chosen stock has high growth potential, congratulations, you found a stock that looks strong fundamentally with great growth potential and that is trading cheap now (undervalued). If not, you can wait a bit until company fundamentals change and repeat the above analysis. Another alternative approach in finding great trade ideas, stocks that look strong fundamentally with great growth potential is to use different stock market analysis apps. But don't forget that recommendations that different apps provide are just suggestions, and there is no app or approach that can forecast the stock price with high accuracy. Also, investing in stocks brings high risks, that's why don't forget to allocate assets properly in your portfolio to minimize portfolio loss or maximize its expected return, and also, you should understand companies that you are buying. I always tell my students that buying stocks is about buying companies, that's why it's important to understand their business to make timely investment decisions and react quickly to market changes. Only then you have higher chances of generating positive returns over the longer term. I hope my post was useful. Please share it if you find it valuable to help me spread the knowledge.
Other Blogs
Sep 10, 2024 7:33 AM - Parth Sanghvi
Best Alternatives to Yahoo Finance for Downloading Historical Stock Data
When it comes to downloading historical stock data, Yahoo Finance has been a popular choice for many. However, for those looking for more comprehensive, accurate, and flexible options, Financial Modeling Prep (FMP) offers a suite of powerful tools and services that stand out as superior alternatives...
Nov 8, 2024 5:30 AM - Sanzhi Kobzhan
Understanding Equity Valuation: When to Use DCF, DDM, and Price-Income (Multiplicators) Models
When it comes to investing in stocks, one of the key decisions an investor must make involves determining the intrinsic value of a company's shares. Equity valuation isn't just about numbers, it's an art mixed with science, aiming to predict future performance based on current and historical data. H...
Nov 22, 2024 5:08 AM - Parth Sanghvi
Fundamental Analysis: Principles, Types, and How to Use It
Fundamental analysis is one of the most essential tools for investors and analysts alike, helping them assess the intrinsic value of a stock, company, or even an entire market. It focuses on the financial health and economic position of a company, often using key data such as earnings, expenses, ass...