FMP
Drag‑and‑Drop Charting: Visualize FMP Data in Google Sheets
Aug 12, 2025
Drag‑and‑drop charting lets developers turn FMP data into interactive visuals without code. In this article, I show how to use FMP's CSV export endpoint and Google Sheets' built-in charts to build time‑series graphs and scatterplots. You'll learn steps that let you fetch CSV data from FMP, load it into sheets, and drag fields into charts—all without writing JavaScript.
In this guide, you'll learn how to:
- Access FMP's CSV endpoint for historical stock or financial data.
- Visualize time series using Google Sheets' chart editor.
- Build interactive visuals via drag‑and‑drop—no code needed.
Step 1 - Fetch CSV Data from FMP Export Endpoints
FMP supports CSV output for most APIs by adding `datatype=csv` to the URL. For example, for Stock Price API data:
- https://financialmodelingprep.com/api/v3/historical-price-full/AAPL?apikey=YOUR_API_KEY&datatype=csv
This returns a clean CSV file with date, open, high, low, close, and volume—ready for spreadsheet use.
Why CSV matters
CSV (Comma-Separated Values) is ideal for spreadsheets. It structures rows and columns for direct use in charting. You avoid JSON parsing and keep your workflow simple.
Expert Tip:
- Test in Browser: You can paste the CSV URL directly into your browser to preview or download the file.
- Supports Most Endpoints: datatype=csv works for many FMP APIs, including stock prices, income statements, balance sheets, and more.
Avoid Rate Limits: If you're working with large datasets, consider batching requests or using the paid tier for higher call volumes.
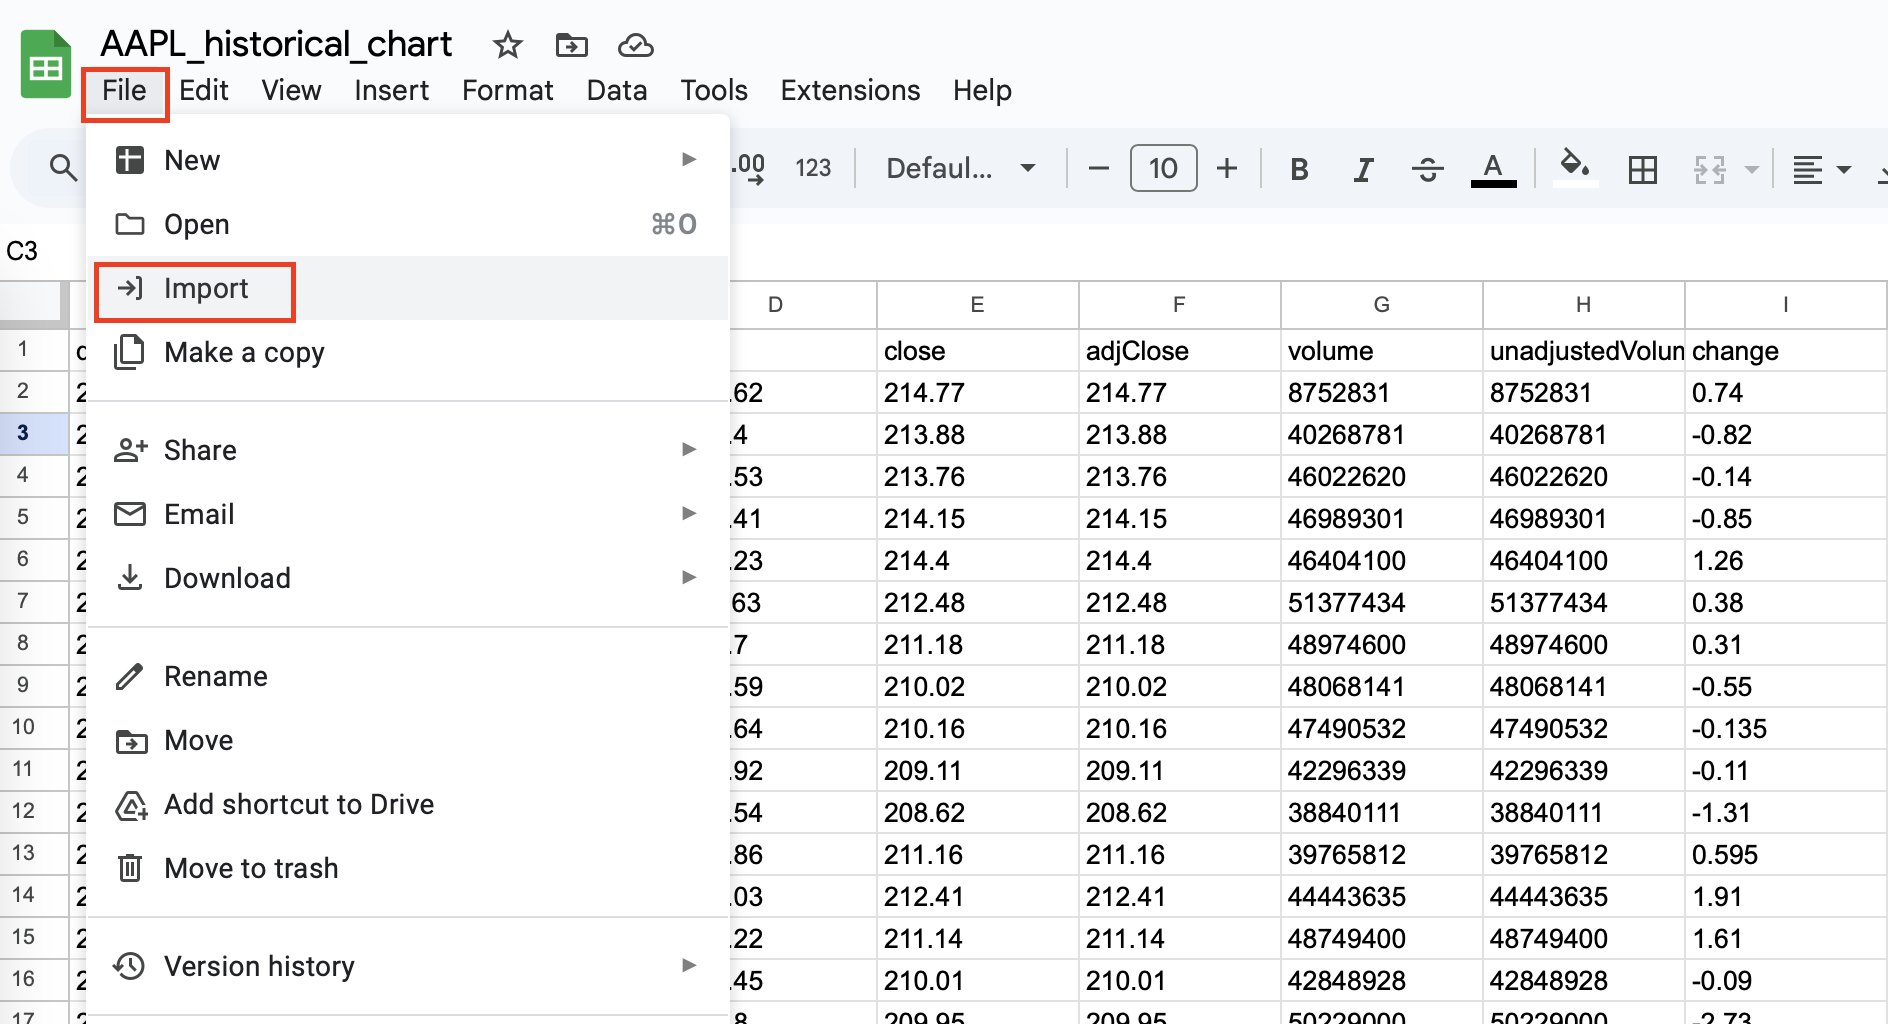
Step 2 - Import CSV into Google Sheets
- Open Sheets and choose File → Import → Upload, then upload your CSV export.
- In import settings, leave "Convert text to numbers, dates, and formulas" unchecked to preserve original formats (especially important for tickers, long numbers, or dates).
- Review your data:
- Ensure date columns are recognized correctly and sorted chronologically.
- Confirm numeric columns (like closing price, volume, or metrics) are formatted as numbers and not text.
- Rename column headers for clarity—this helps when setting up chart labels later.
- Use Freeze row 1 (View → Freeze → 1 row) so your headers stay visible as you scroll.
Expert Tip:
If you're working with frequently updated data, consider using Google Sheets' IMPORTDATA() function to fetch the CSV directly from the API URL:
=IMPORTDATA("https://financialmodelingprep.com/api/v3/historical-price-full/AAPL?apikey=YOUR_API_KEY&datatype=csv")
This lets you skip the manual upload and refresh data dynamically.
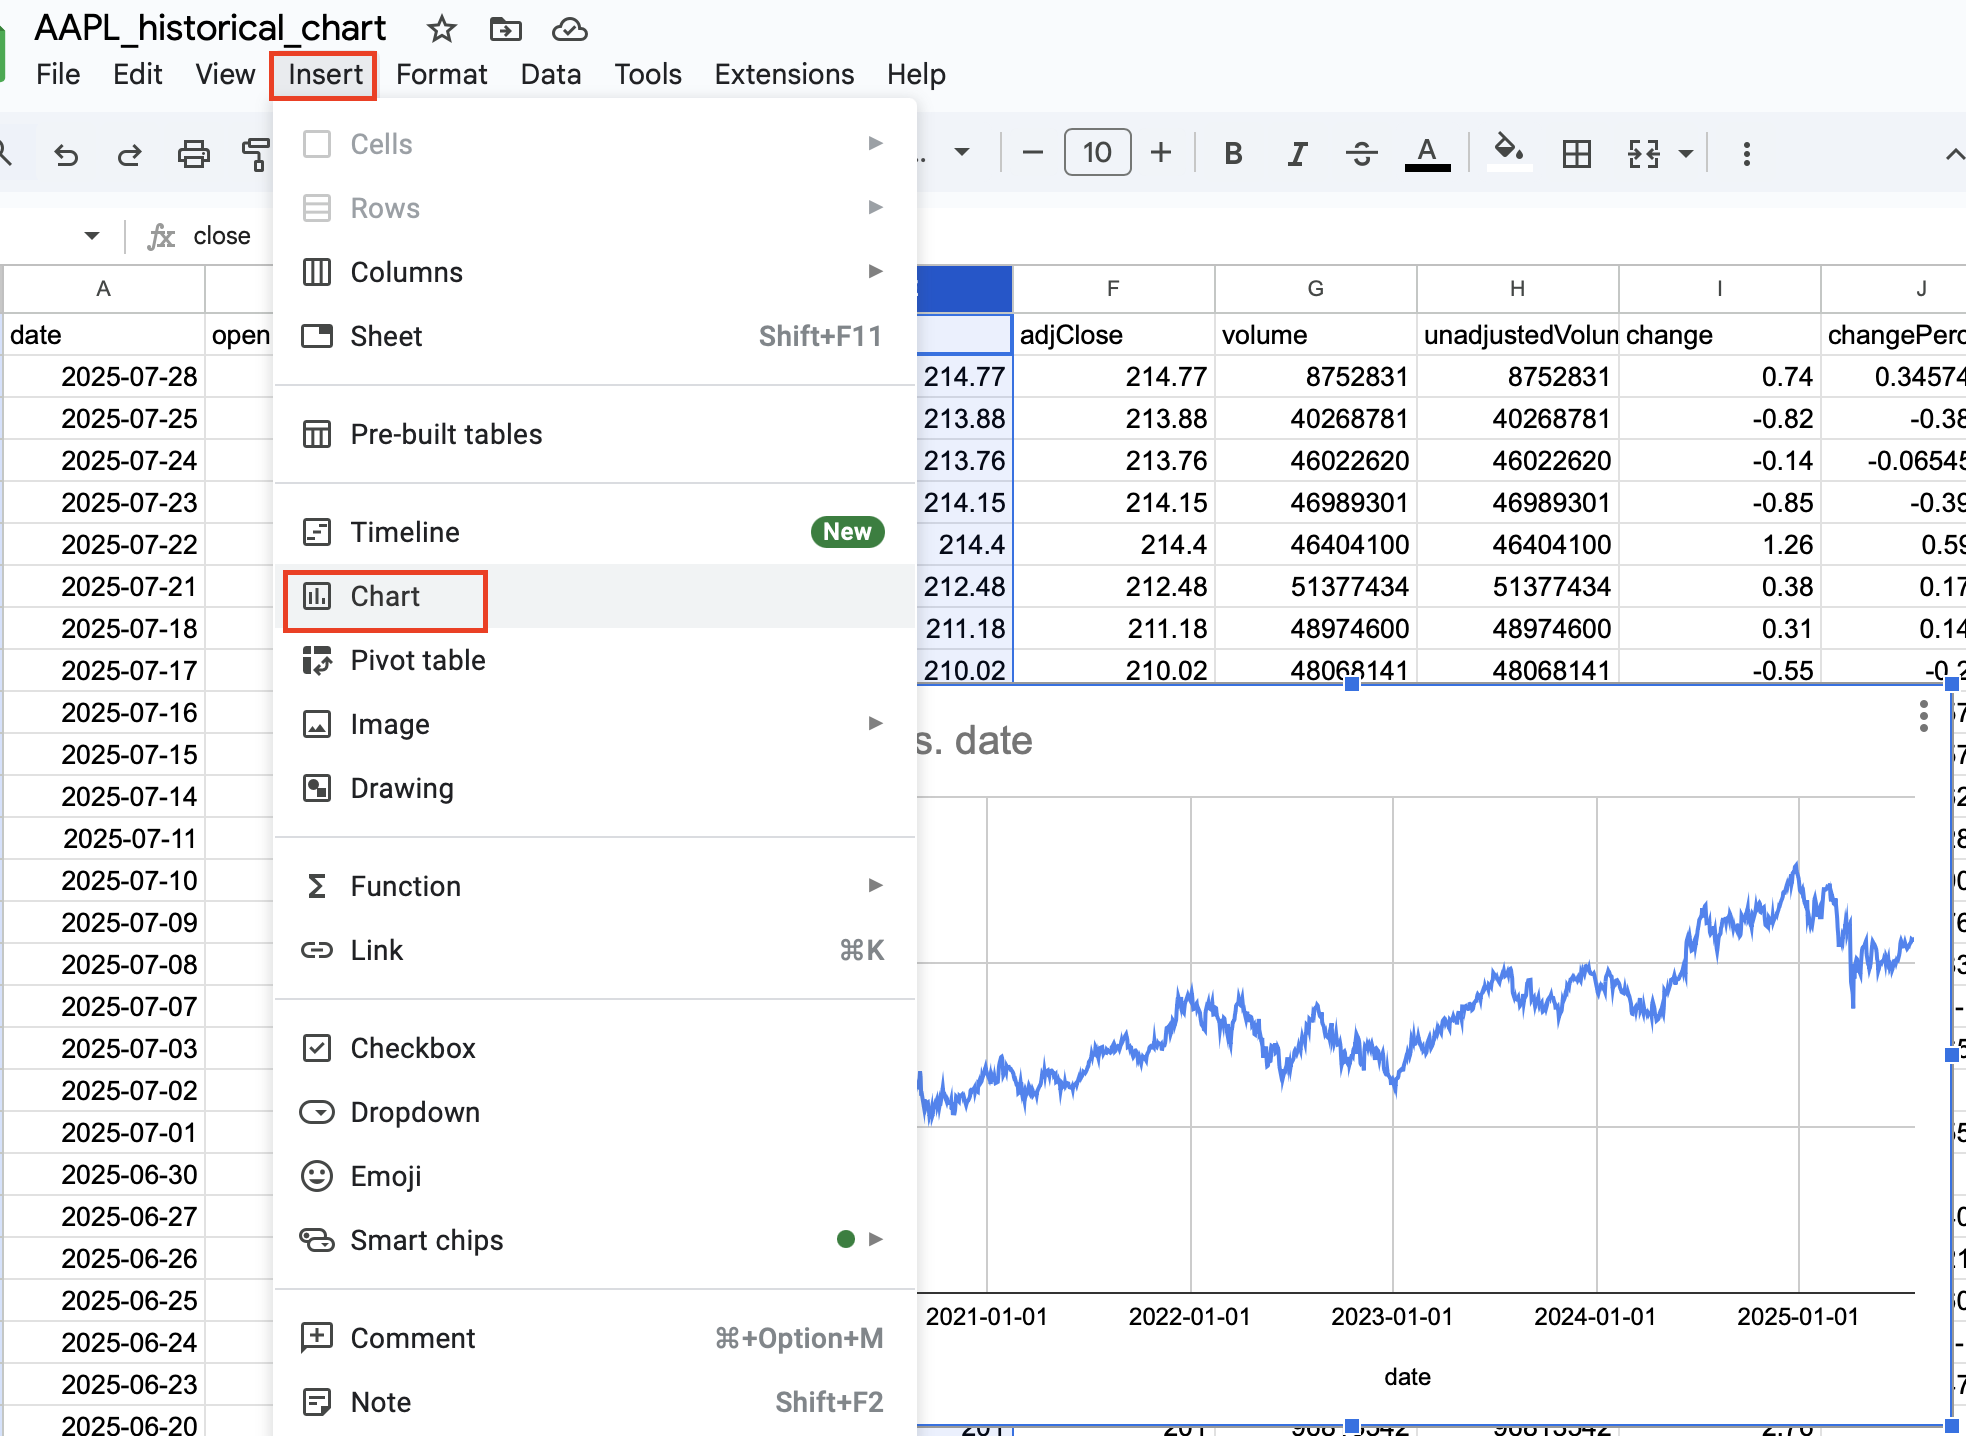
Step 3 - Build Charts via Drag‑and‑Drop
Time‑Series Chart Setup
- Select date column and closing price column.
- Go to Insert → Chart, Google Sheets will suggest a Line chart.
- Use the Chart Editor to:
- Set the X-axis to your date column.
- Set the Y-axis to your value column (e.g., Close or Volume).
- Adjust legends, gridlines, and series styles to enhance readability.
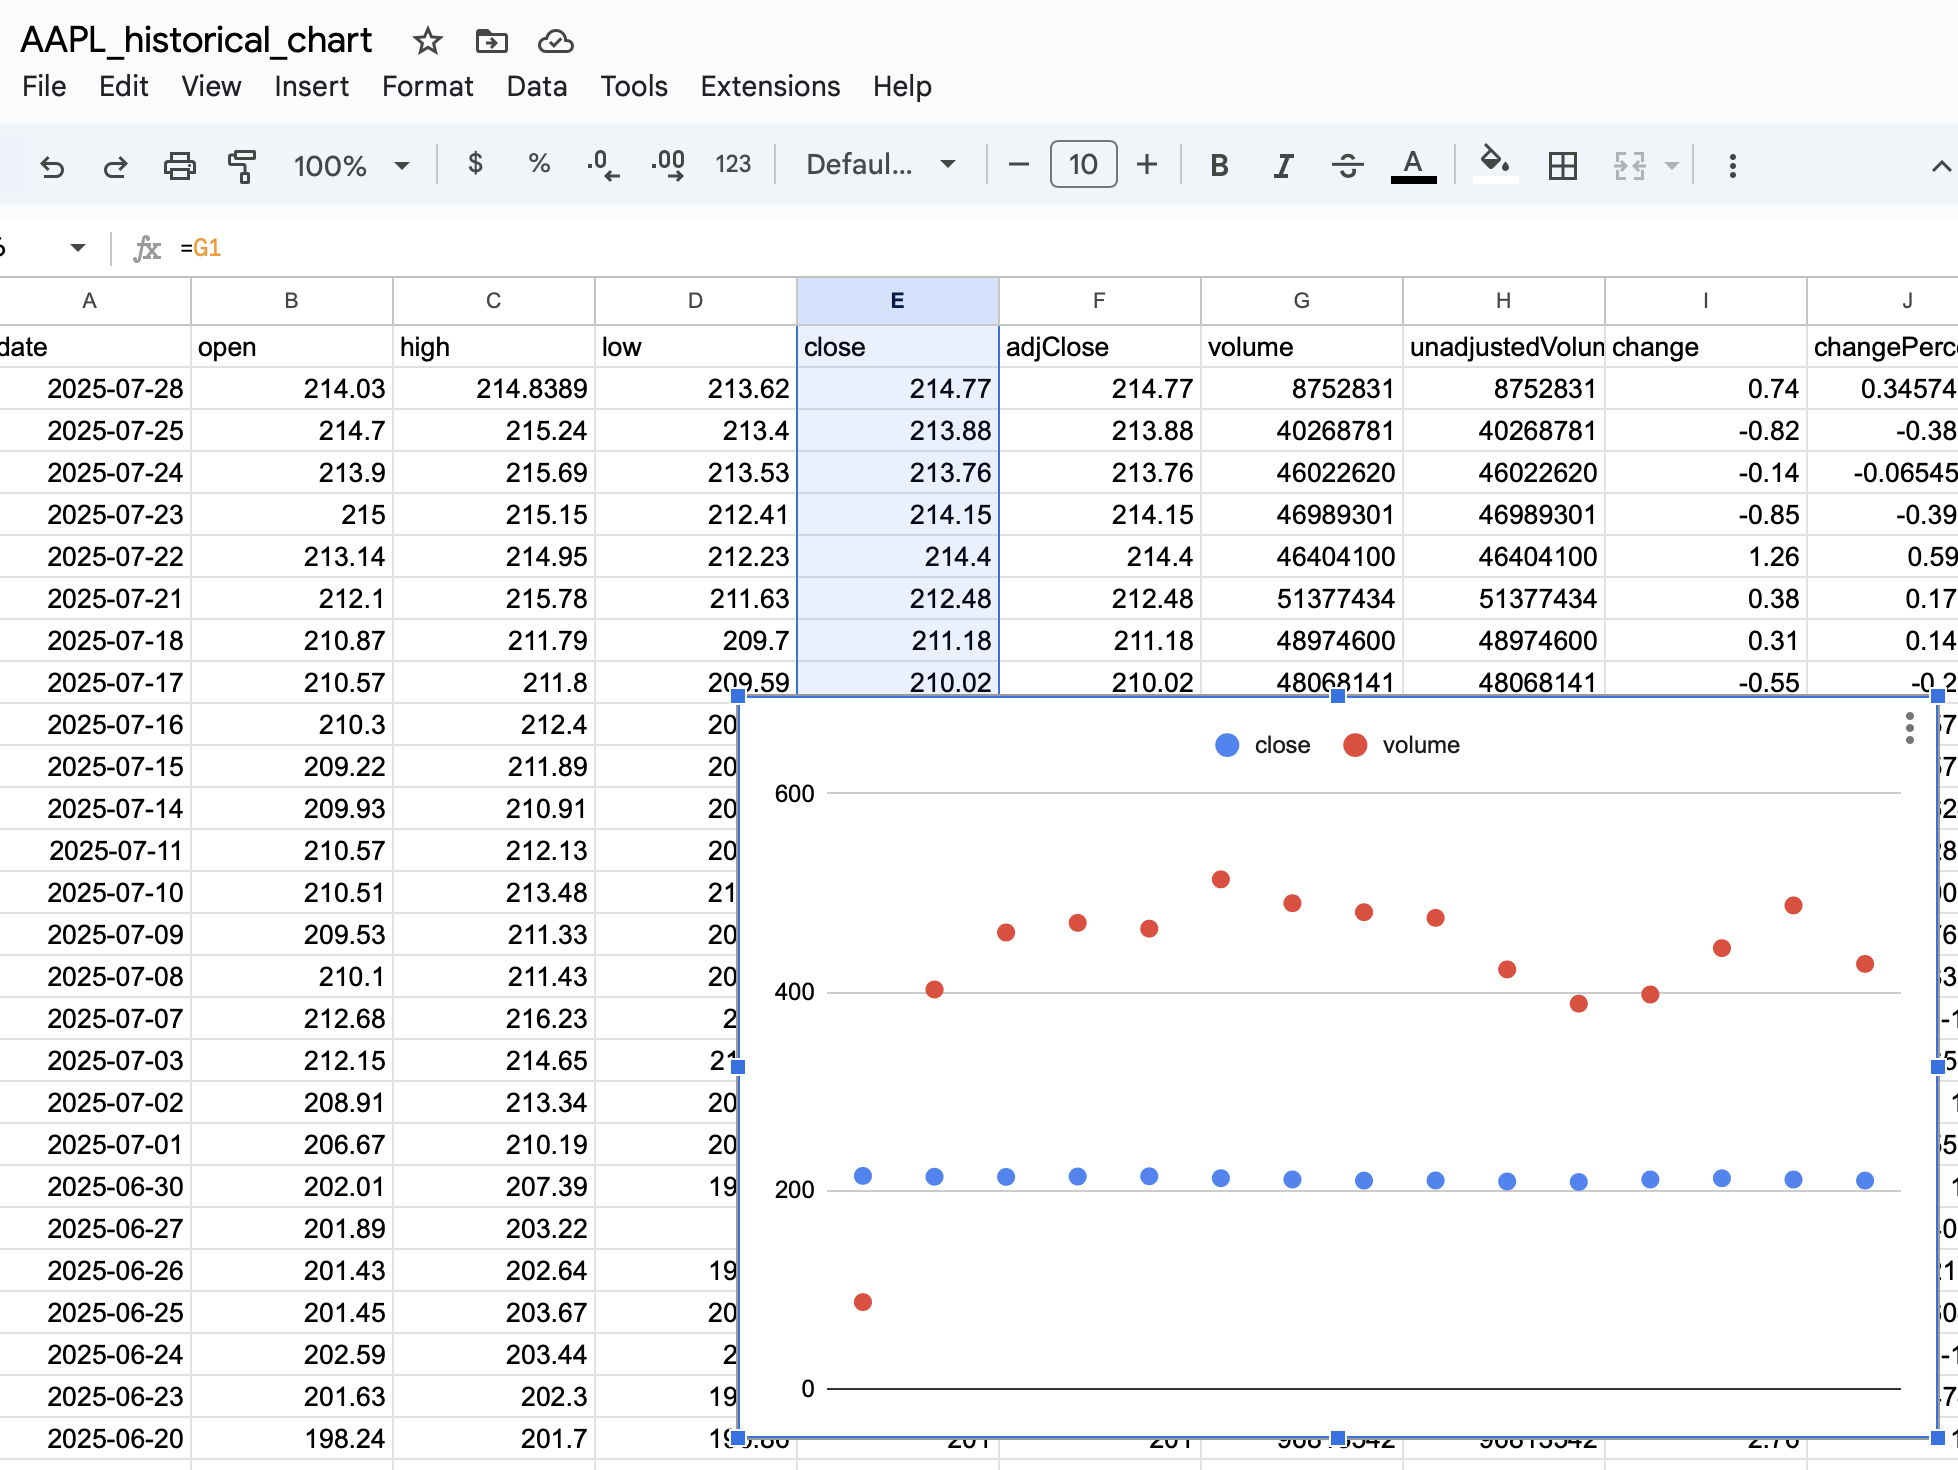
Scatterplot for metrics
To compare metrics (e.g., volume vs. stock price):
- Create two side‑by‑side columns (metric A in X‑axis, metric B in Y‑axis).
- Insert a Scatter chart, then drag series into axis fields.
- Use the Setup tab in the Chart Editor to verify axis assignments.
- Style the chart with different point sizes or colors to distinguish patterns.
Tips for Better Charting:
- Label clearly: Rename column headers before charting to ensure clean axis labels.
- Chart multiple series: For time-series, you can select multiple metrics (e.g., Open, Close, High) to show them in one line chart for richer comparisons.
- Use filters or slicers (via Google Sheets Add‑ons) if you want users to interactively change the charted series or time window.
Expert Tip:
If your dataset updates regularly (e.g., via IMPORTDATA()), charts will auto-refresh, making this setup useful for dynamic dashboards or presentations.
Expert Tips & Use Cases
- Auto‑refresh CSV import: schedule to re-import or use the FMP Sheets add‑on for dynamic updates.
- Sample use case: Compare AAPL stock price time‑series and scatter daily volume vs. closing price.
- Add interactivity: Use Google Sheets' built-in filters and slicers to create dashboards that allow end users to explore different tickers, time ranges, or metrics without editing the sheet structure.
- Combine with other data: Layer in your own metrics or manually entered data (like analyst ratings, sentiment scores, or earnings surprises) to enrich FMP data and customize your visuals.
- Export charts for presentations: Once built, charts can be easily exported as PNGs or embedded into Google Slides for client decks, investment updates, or internal reports.
FAQ
-
Can I refresh data automatically?
Use the FMP Google Sheets add‑on to pull live data via formulas like `=FMP.HISTORICAL(...)`—refreshes without re-uploading CSV
-
Are CSV endpoints limited by plan?
Most CSV endpoints work with the free plan (250 calls/day). Larger bulk endpoints may require paid access.
-
Which chart types work best?
Line charts for time series, scatter plots for metric comparisons. You can use combo charts if needed.
You now know how to link FMP CSV export endpoints with Google Sheets chart tools to build rich visuals—time‑series and scatter plots—completely without JavaScript. Use FMP data, upload CSV, then drag and drop into charts. For live updates, test the FMP add‑on directly within Sheets. Want to dive deeper? Check FMP's historical chart API or key metrics dataset next. Start visualizing your data today!

MicroStrategy Incorporated (NASDAQ:MSTR) Earnings Preview and Bitcoin Investment Strategy
MicroStrategy Incorporated (NASDAQ:MSTR) is a prominent business intelligence company known for its software solutions a...

WACC vs ROIC: Evaluating Capital Efficiency and Value Creation
Introduction In corporate finance, assessing how effectively a company utilizes its capital is crucial. Two key metri...

BofA Sees AI Capex Boom in 2025, Backs Nvidia and Broadcom
Bank of America analysts reiterated a bullish outlook on data center and artificial intelligence capital expenditures fo...

