FMP
What Are Japanese Candlesticks and How to Use Them to Get Valuable Trade Signals?
Aug 27, 2024
Japanese candlesticks are a popular tool used by traders to analyze stock prices and make trading decisions. These candlesticks provide a visual representation of price movements over a specific time period, helping traders see the patterns that emerge. The technique originated in Japan over 300 years ago and remains one of the most effective ways to understand market trends. With Japanese Candlesticks, traders can analyze stock volatility, trading irregularities (gaps), and forecast the possible direction of the trend.
How to Build a Japanese Candlestick
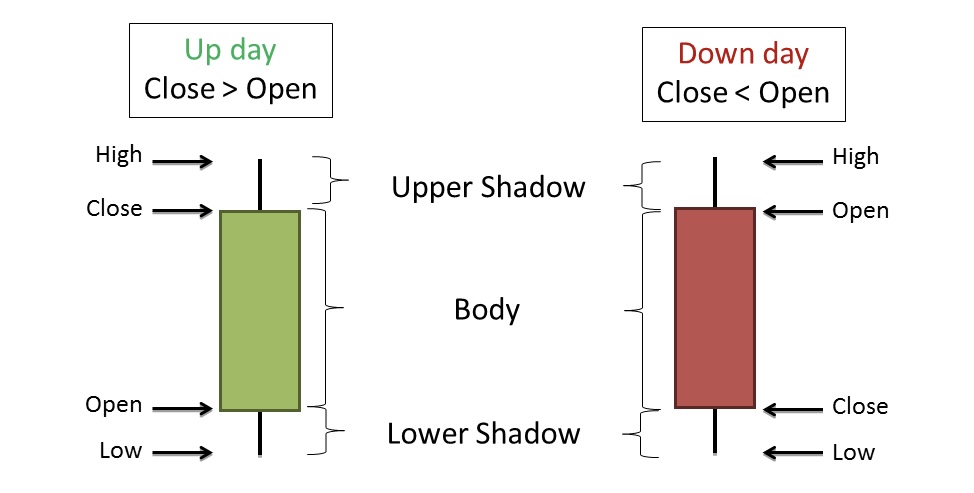
Each candlestick consists of four key parts:
1. Open Price: The price of the stock at the beginning of the time period.
2. Close Price: The price at the end of the time period.
3. High Price: The highest price reached during the time period.
4. Low Price: The lowest price reached during the time period.
The body of the candlestick is formed between the open and close prices. If the close price is higher than the open price, the body is typically green, indicating a price increase. If the close price is lower than the open price, the body is usually red, indicating a price decrease.
The lines extending above and below the body are called "wicks" or "shadows." These represent the high and low prices for the time period. To build Japanese candlesticks, you can use the Financial Modeling Prep Intraday Chart API. You can choose the time frame to define how often the prices will be updated. For example, a 5-minute time frame means that prices will be fetched every 5 minutes, and you will be able to build a new candle every 5 minutes. The mentioned API endpoint has information on stock open, high, low, and close prices, and you can use this information to build a candlestick.
How to Analyze Candlestick Patterns
Candlestick patterns are formed by one or more candlesticks and can signal potential price movements. Here are some popular patterns and what they indicate:
1. Doji. A Doji occurs when the open and close prices are nearly the same, forming a very small body. A Doji suggests indecision in the market. It can signal a potential reversal in the trend, especially if it appears after a strong upward or downward movement.
2. Hammer. A Hammer has a small body at the top and a long lower wick, with little or no upper wick. A Hammer usually appears after a downtrend and signals a potential reversal to the upside. It shows that buyers are starting to gain control after sellers pushed prices lower.
3. Shooting Star. The opposite of a Hammer, a Shooting Star has a small body at the bottom and a long upper wick, with little or no lower wick. A Shooting Star typically appears after an uptrend and indicates a potential reversal to the downside. It shows that buyers pushed prices up, but sellers quickly took over.
4. Engulfing Pattern. An Engulfing Pattern consists of two candlesticks. In a Bullish Engulfing pattern, a small red candle is followed by a larger green candle that completely engulfs the red one. In a Bearish Engulfing pattern, a small green candle is followed by a larger red candle. A Bullish Engulfing pattern signals a potential reversal to the upside, while a Bearish Engulfing pattern suggests a possible reversal to the downside.
5. Morning Star and Evening Star. These are three-candle patterns. A Morning Star consists of a large red candle, a small candle (red or green) with a gap down, and then a large green candle with a gap up. An Evening Star is the reverse: a large green candle, a small candle with a gap up, and a large red candle with a gap down. A Morning Star signals a potential reversal to the upside after a downtrend, while an Evening Star indicates a potential reversal to the downside after an uptrend.
Analyzing Japanese candlesticks manually and defining trading patterns takes time, and you can miss important signals sometimes. To automate candlestick analysis, traders can use the Stocks 2 Buy app, which analyzes candlestick patterns and provides intraday trading recommendations based on the analysis. Patterns give valuable hints on the future possible trend trajectory and can help traders define the strength and direction of the trend. However, traders should use several indicators to define the trend, as relying on a single pattern or indicator limits the analysis.
Japanese candlesticks are a powerful tool for traders, providing a clear picture of price movements and potential market trends. By learning how to build and analyze these patterns, you can make more informed trading decisions. Start by familiarizing yourself with popular patterns like the Doji, Hammer, Shooting Star, Engulfing Patterns, and Morning/Evening Stars, and use them to enhance your trading strategy.

How an Economic Moat Provides a Competitive Advantage
Introduction In the competitive landscape of modern business, companies that consistently outperform their peers ofte...

Apple’s Slow Shift from China to India: Challenges and Geopolitical Risks
Introduction Apple (NASDAQ: AAPL) has been working to diversify its supply chain, reducing dependence on China due to...

MicroStrategy Incorporated (NASDAQ:MSTR) Earnings Preview and Bitcoin Investment Strategy
MicroStrategy Incorporated (NASDAQ:MSTR) is a prominent business intelligence company known for its software solutions a...