FMP
The Candlestick Trading Bible: Mastering Candlestick Patterns for Spotting Trend Changes
Feb 05, 2025(Last modified: Nov 28, 2025)
Welcome to the Candlestick Trading Bible, your ultimate guide to understanding and utilizing candlestick patterns in the stock market. Whether you're a beginner or an experienced trader, mastering candlestick patterns can significantly enhance your trading strategy. Here, we'll decode how to read these patterns and highlight some of the most crucial ones. Plus, we'll walk you through creating a simple app to visualize these patterns using JavaScript.
Understanding Candlestick Patterns
Candlestick charts are one of the most popular tools in technical analysis, originating from Japan in the 18th century. Each "candle" on the chart represents price movements within a specific timeframe, giving traders insights into market sentiment.
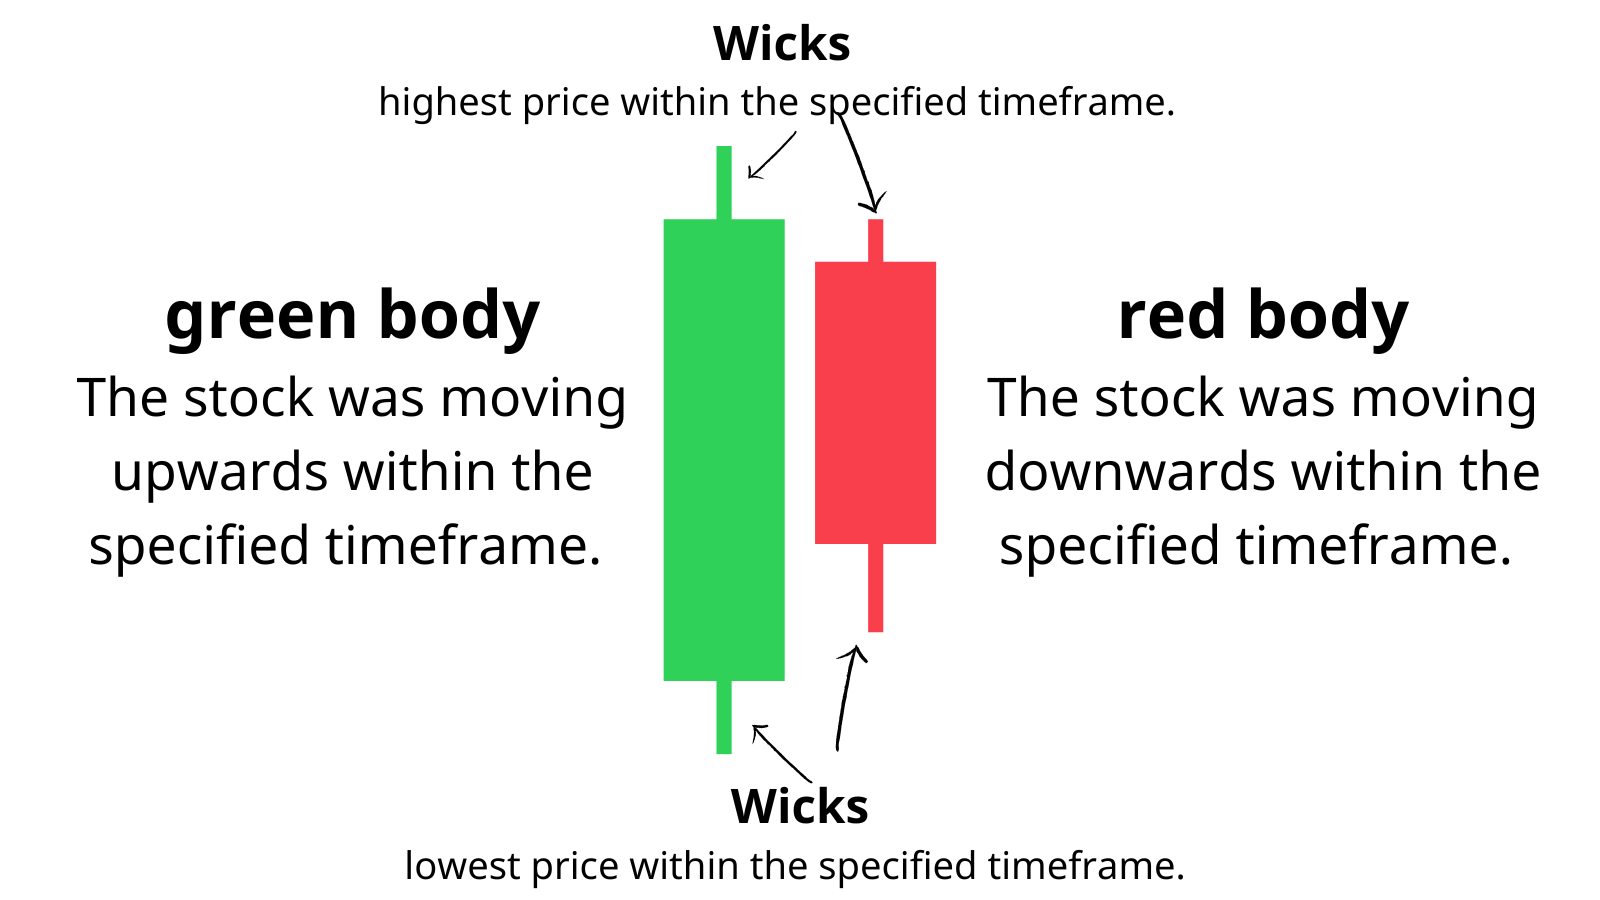
Basic Structure of a Candlestick:
- Body: The wide part of the candle shows the opening and closing prices. If the close is higher than the open, the body is typically white or green (bullish). If the close is lower, it's usually black or red (bearish).
- Wicks (or Shadows): The thin lines above and below the body represent the highest and lowest prices during that period.
Key Candlestick Patterns
Here are some essential candlestick patterns you should know:
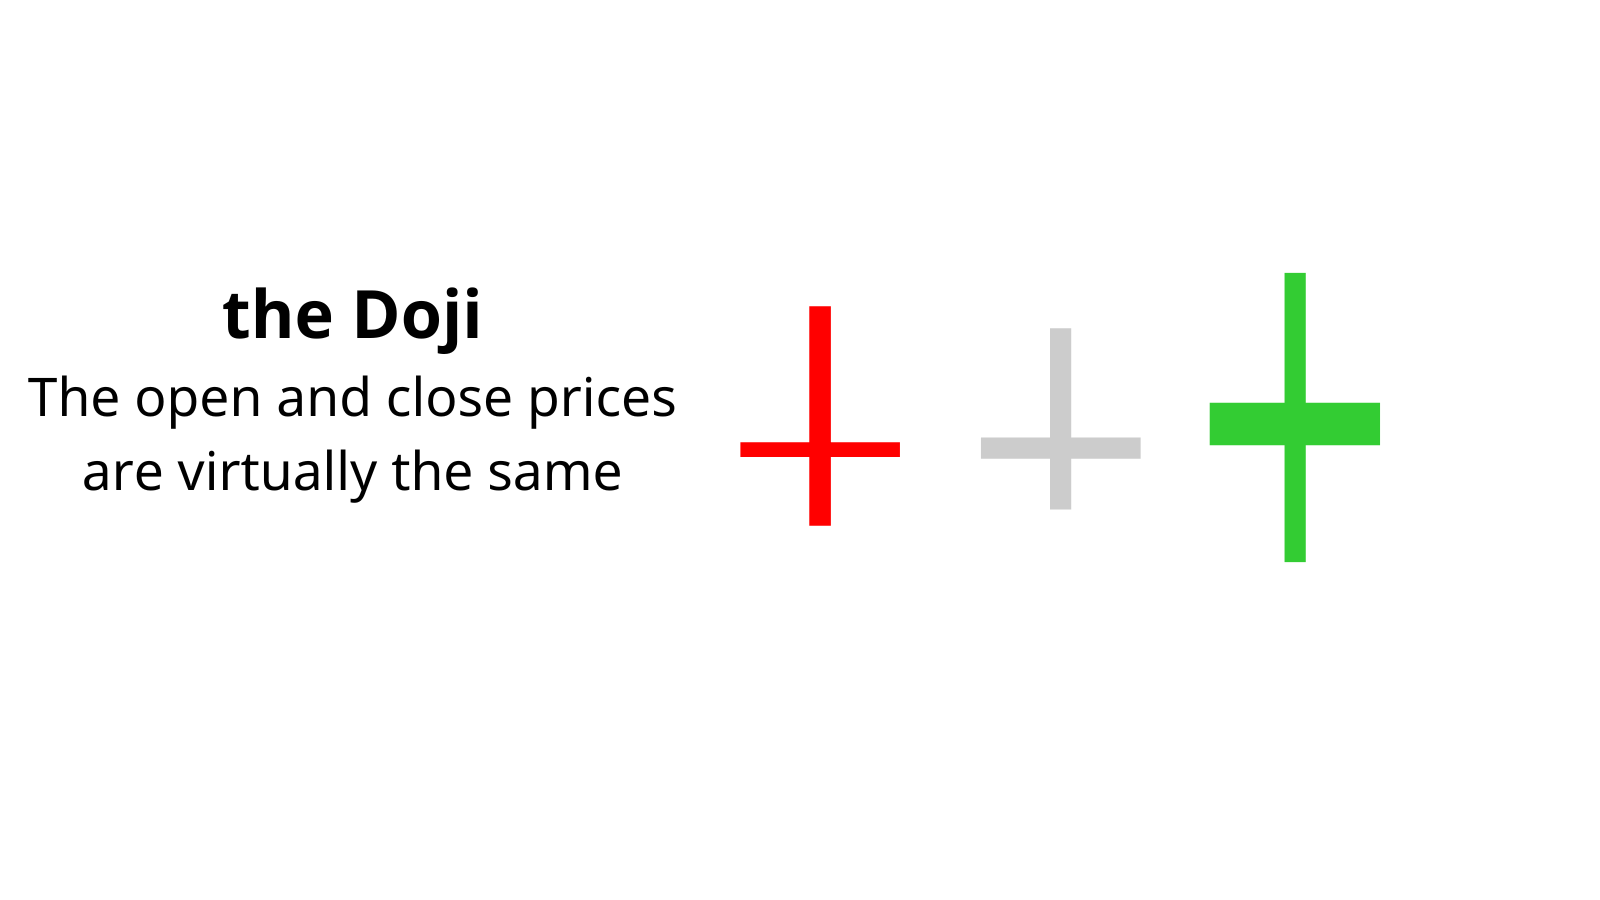
Doji - Indicates indecision in the market. The open and close prices are virtually the same, creating a cross or plus sign shape.
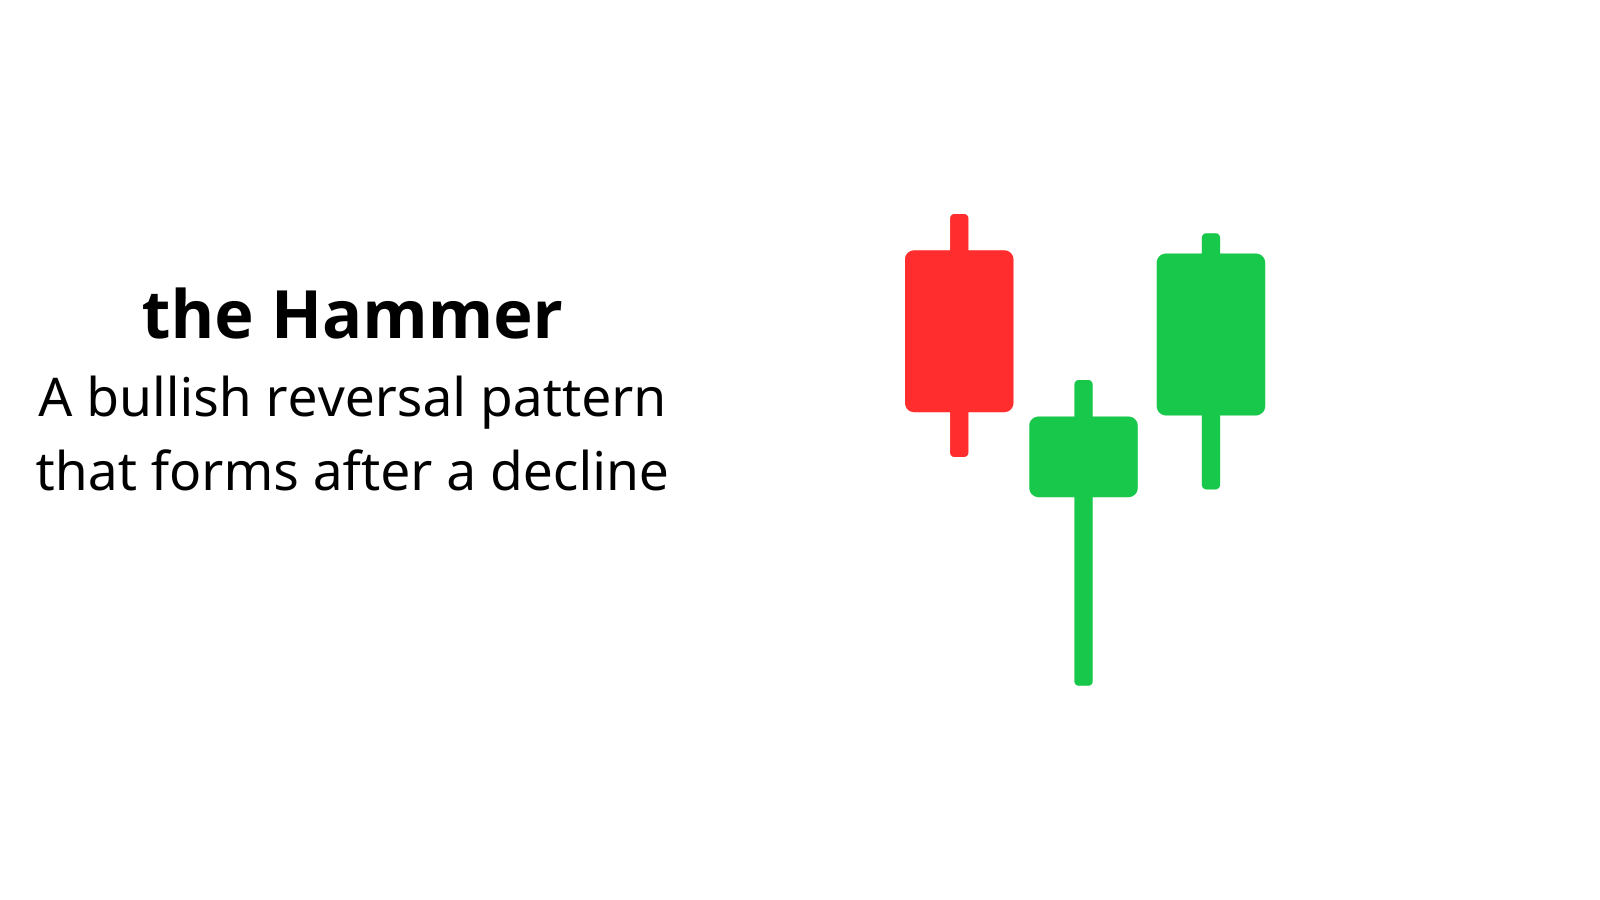
Hammer - A bullish reversal pattern that forms after a decline. It has a small body with a long lower wick, suggesting that after significant selling, buyers step in to drive the price up.
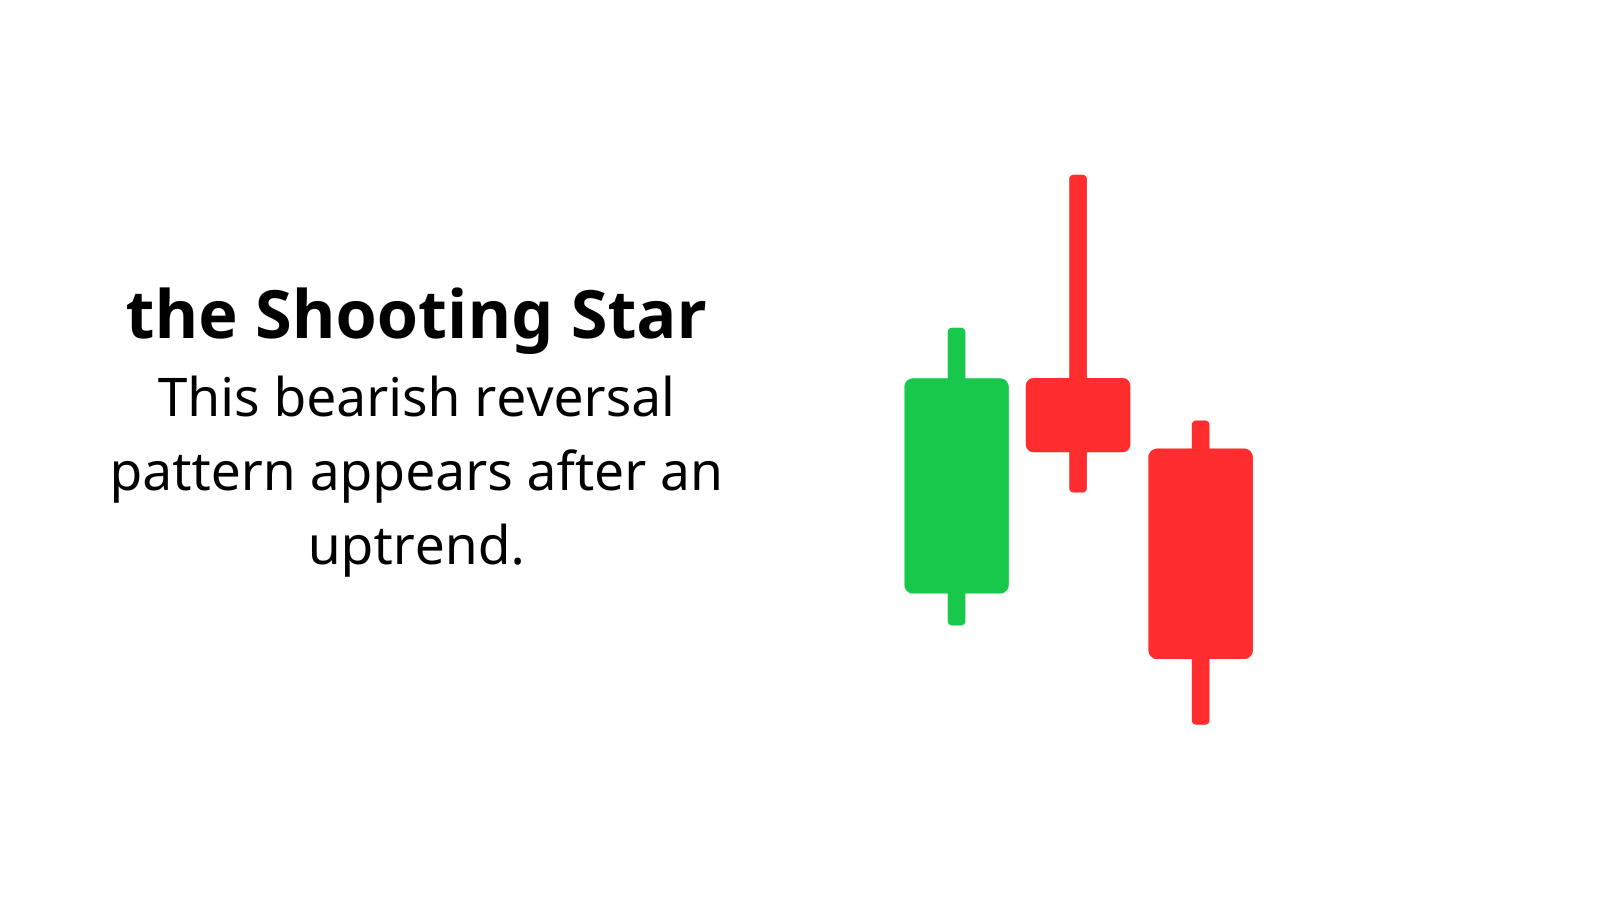
Shooting Star - This bearish reversal pattern appears after an uptrend. It's characterized by a small body at the lower end of the trading range with a long upper wick, signaling that sellers might take control.
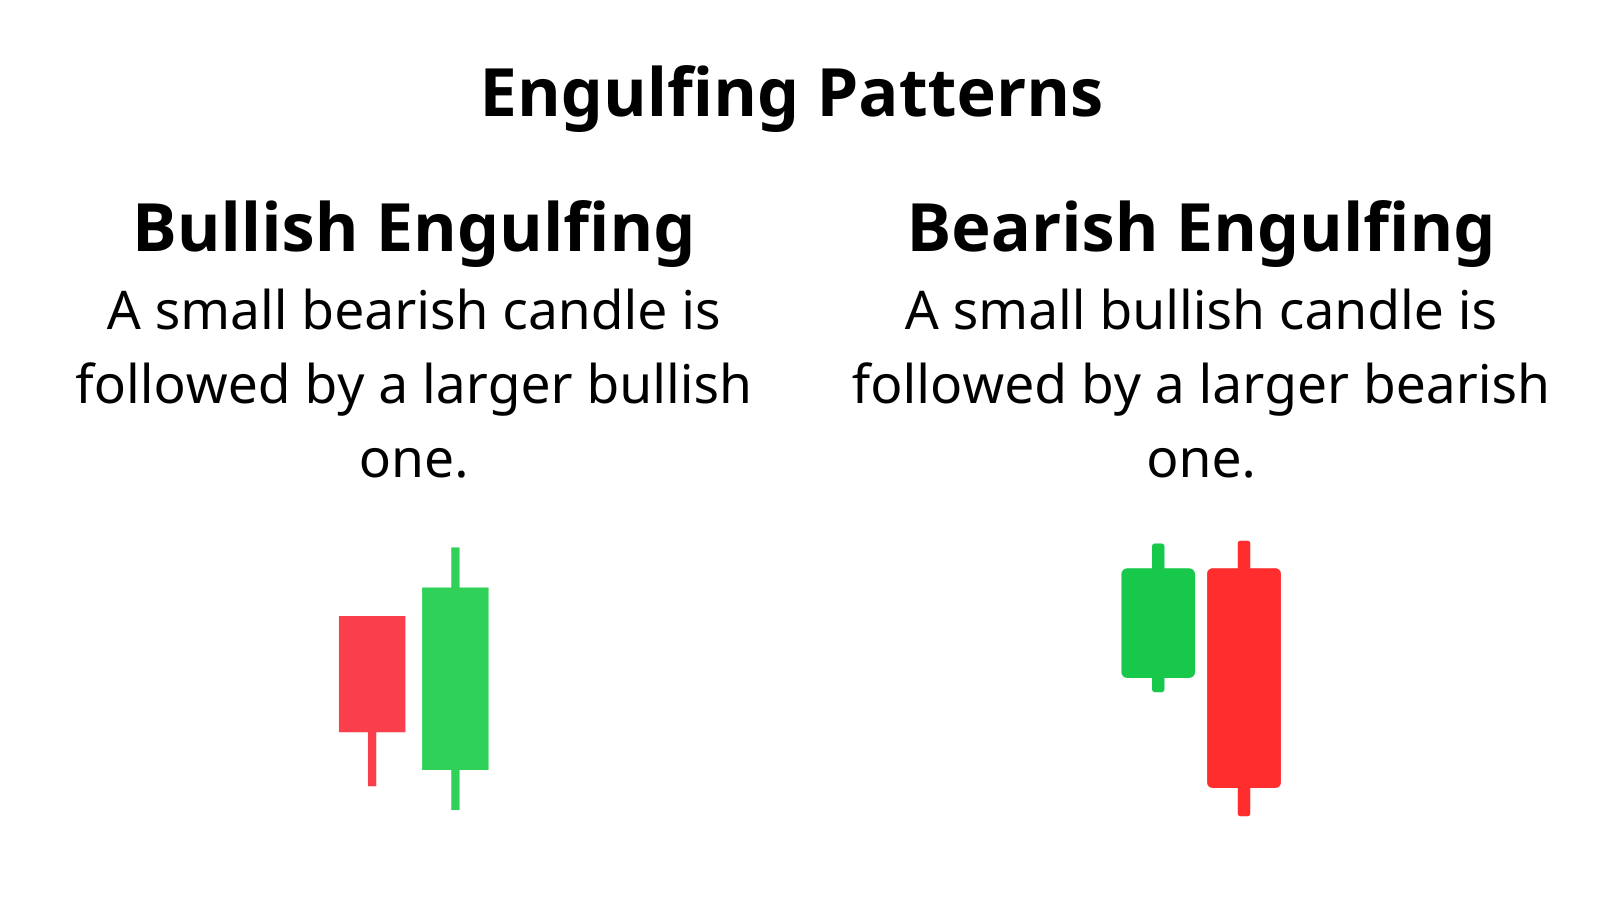
Engulfing Patterns:
-
- Bullish Engulfing: A small bearish candle is followed by a larger bullish one, completely enveloping the first candle.
- Bearish Engulfing: Opposite of bullish engulfing, where a small bullish candle is followed by a larger bearish one.
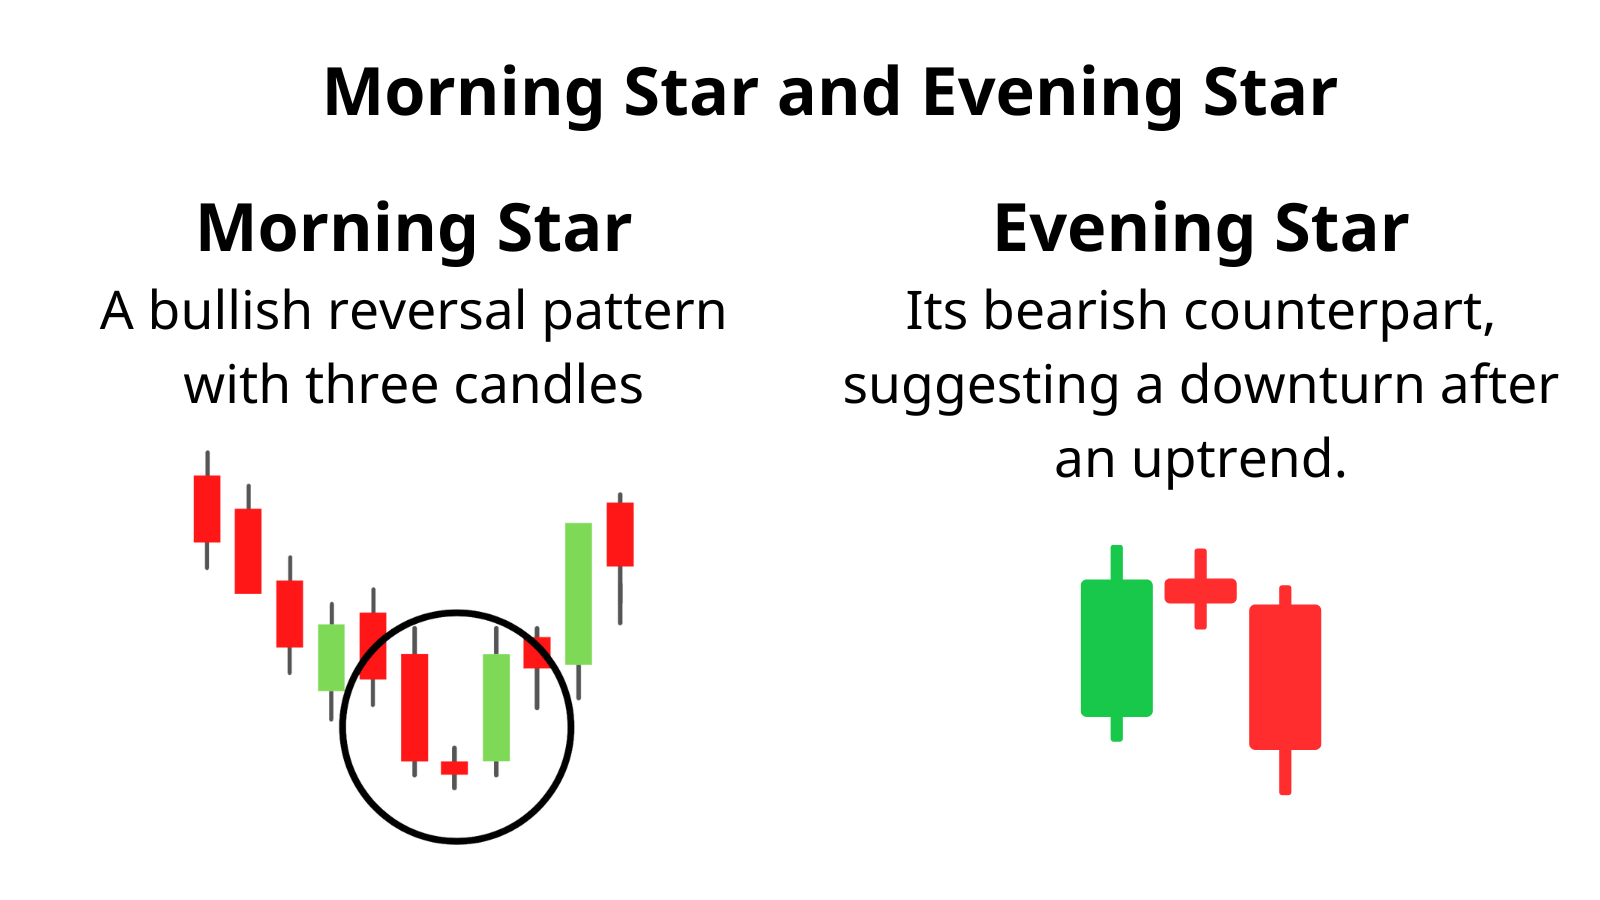
Morning Star and Evening Star
- Morning Star: A bullish reversal pattern with three candles: a long bearish, a small-bodied candle (can be bullish or bearish), and a long bullish candle.
- Evening Star: Its bearish counterpart, suggesting a downturn after an uptrend.
Building Your Own Candlestick Chart App
Step 1: Setting Up Your Development Environment
Download and Install Visual Studio Code (VSCode):
- Visit the VSCode Website: Go to code.visualstudio.com in your browser.
- Download for Your OS: Click on the download button for your operating system (Windows, macOS, or Linux).
- Open VSCode: Once installed, open VSCode.
Step 2: Preparing Your Project
- Create a New Folder for Your Project:
- Use the file explorer to create a new folder named CandlestickChartApp on your desktop or preferred location.
- Open the Folder in VSCode:
- In VSCode, go to File > Open Folder and select your CandlestickChartApp folder.
- Create Project Files:
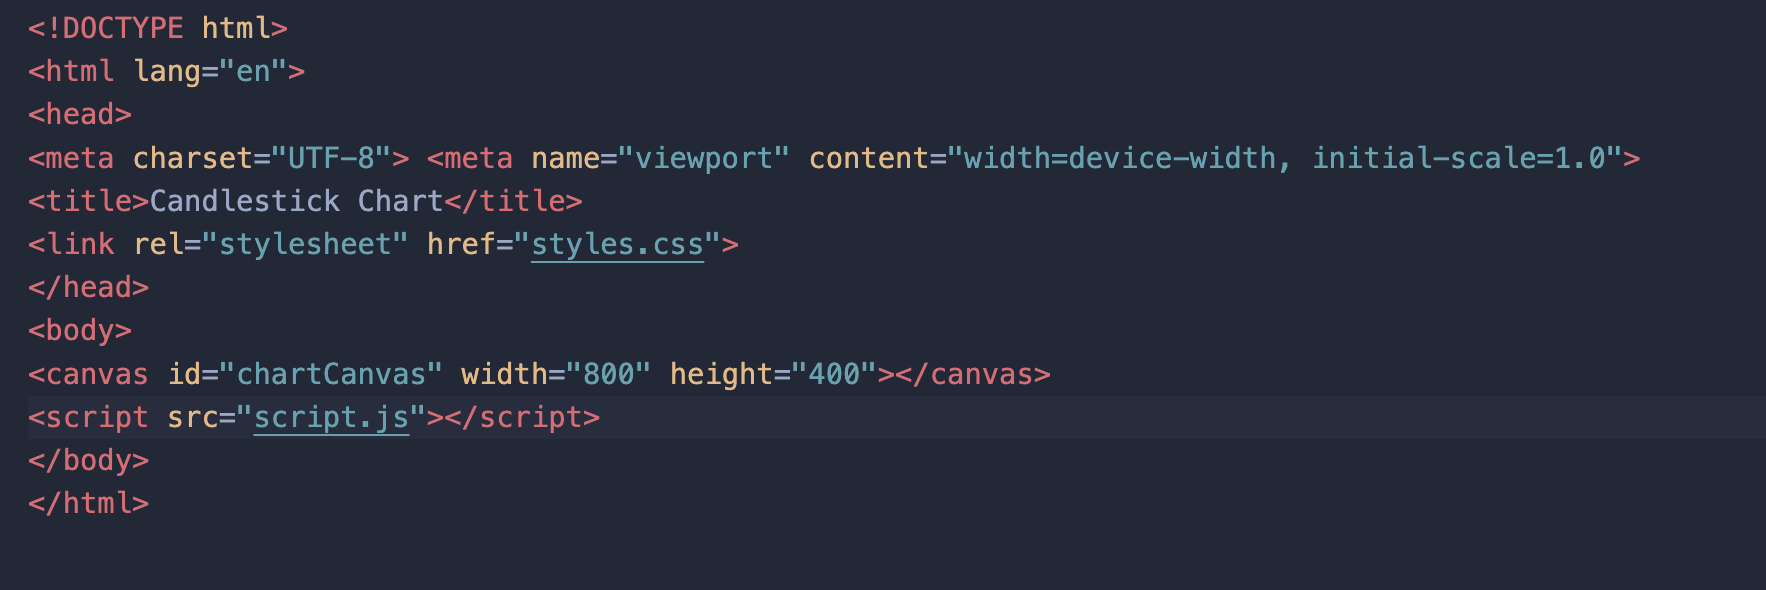
- index.html: This will contain the HTML structure.
- script.js: Where you'll write your JavaScript.
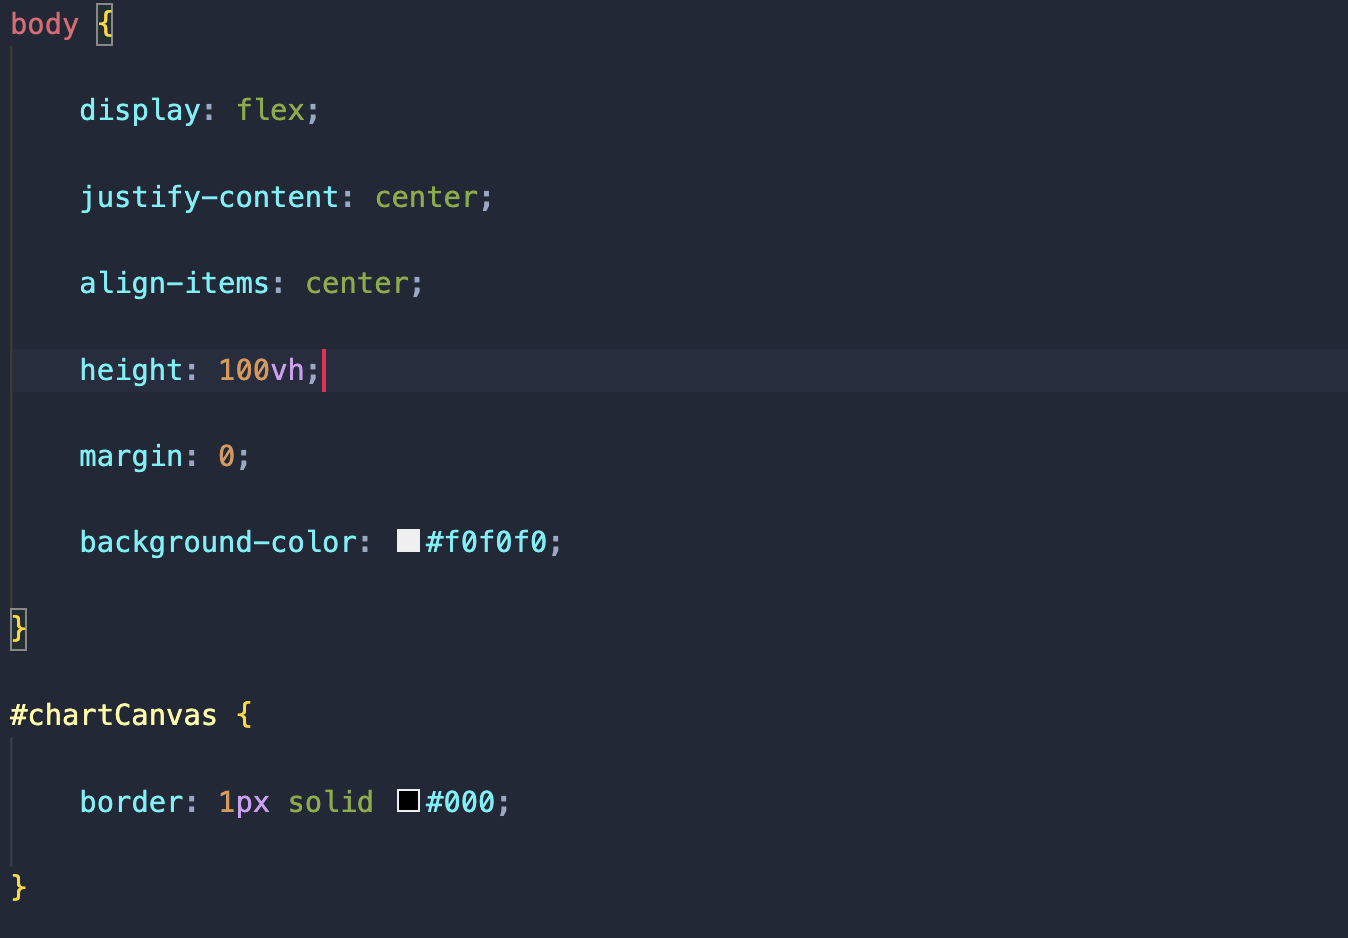
- styles.css: For styling your chart.
copy the below code inside your index.html file:
copy the below code inside your styles.css file:
Step 3: Writing the JavaScript Code
copy the below code inside your script.js file:
Step 4: Running Your App
- Open index.html in a Browser: Right-click index.html in VSCode, choose "Open with Live Server" if you have the Live Server extension, or directly open it with your web browser.
After dragging the file to the browser you will see a graph that should look like this.
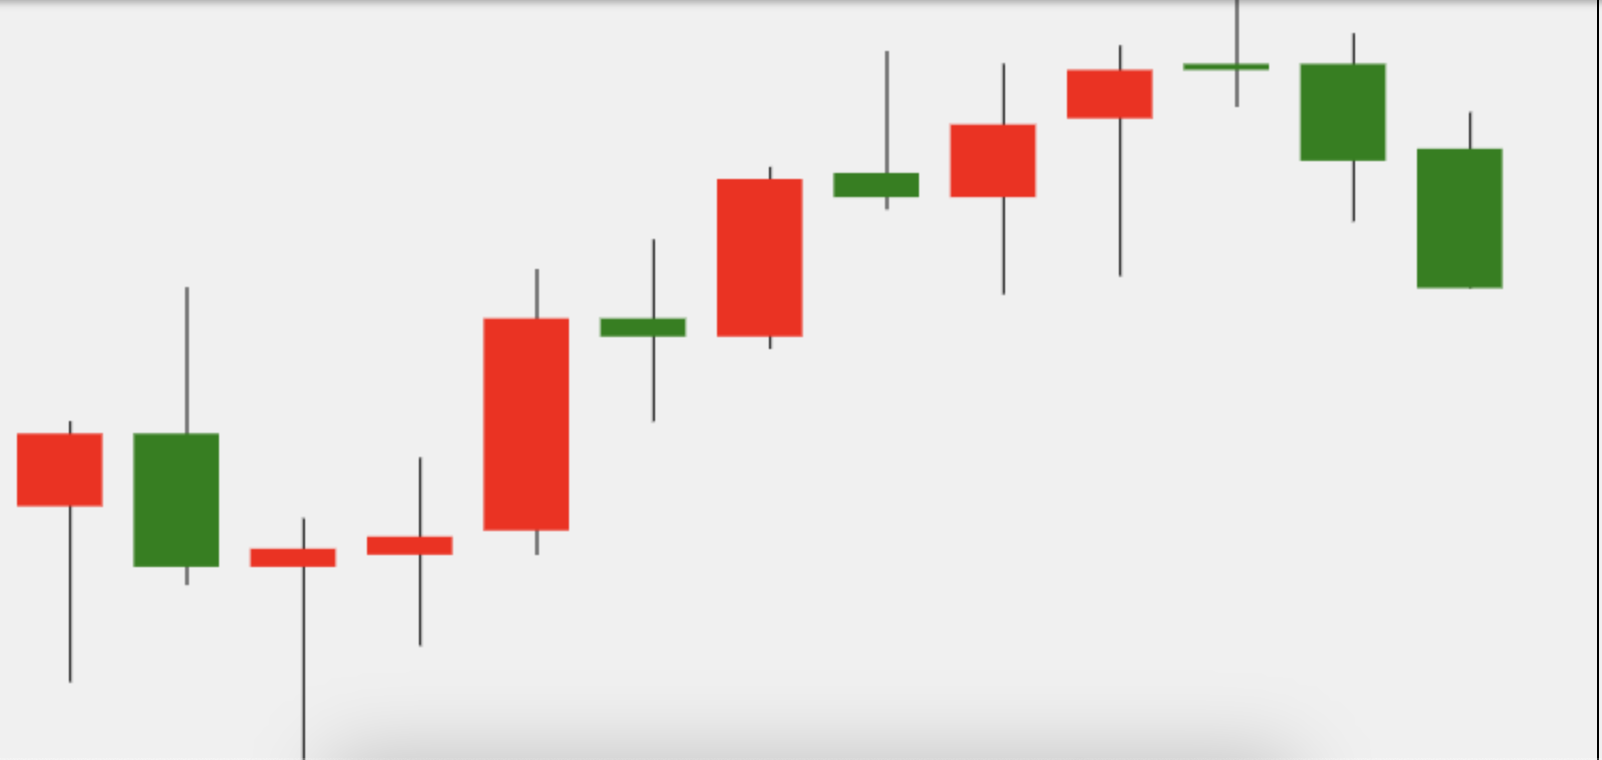
Now you can analyze the graph to spot patterns that we discussed earlier.
Notes:
- API Key: You need to replace 'YOUR_API_KEY' with an actual API key from Financial Modeling Prep.
- Stock symbol: In this line "const symbol = 'AAPL';" you should replace AAPL with your decired stock symbol
This guide should give you a good start in creating your candlestick chart application. Remember, this is a basic implementation; you might want to add more features like zooming, panning, or real-time updates for a more sophisticated tool. I hope it was helpful. Now you know about important candlestick patterns that can change the direction of the trend and know how to draw candlestick graph using stock prices. The Candlestick Trading Bible is here to help you navigate the complex world of candlestick patterns. By understanding these patterns, you can make more informed decisions in trading. Moreover, building your own tools, like the simple JavaScript app we've outlined, can give you a practical edge in visualizing market trends. Remember, while candlestick patterns offer valuable insights, they should be one part of a broader trading strategy. Happy trading, and may your charts always show green candles!

MicroStrategy Incorporated (NASDAQ:MSTR) Earnings Preview and Bitcoin Investment Strategy
MicroStrategy Incorporated (NASDAQ:MSTR) is a prominent business intelligence company known for its software solutions a...

WACC vs ROIC: Evaluating Capital Efficiency and Value Creation
Introduction In corporate finance, assessing how effectively a company utilizes its capital is crucial. Two key metri...

BofA Sees AI Capex Boom in 2025, Backs Nvidia and Broadcom
Bank of America analysts reiterated a bullish outlook on data center and artificial intelligence capital expenditures fo...

