FMP
Price-to-Earnings Ratio: Calculation, Use Cases, and Pitfalls
Sep 15, 2025
If you pay $50 for a stock that earned $2 in profit last year, are you getting a good deal? Many junior analysts grapple with this question using the price-to-earnings ratio. The Price-to-Earnings (P/E) ratio is one of the most popular metrics for stock valuation - but it's also easy to misunderstand.
In this article, we'll demystify the P/E ratio by explaining how it's calculated, walking through an example, clarifying forward vs. trailing P/E, and highlighting common use cases as well as pitfalls to avoid.
By the end, you'll know how to leverage P/E in your analysis with confidence, using the right data (including an API example) and best practices taught in the CFA curriculum for comparison and valuation.
P/E Ratio Definition and Formula
The Price-to-Earnings (P/E) ratio measures how much investors are willing to pay for each $1 of a company's earnings. In simple terms, it is calculated as:
P/E Ratio = Current Share Price ÷ Earnings Per Share (EPS)
For example, if a company's stock trades at $10 and its EPS (earnings per share) over the last year was $1, the P/E would be 10. This means investors are paying 10 times the company's earnings for its stock. In other words, at a P/E of 10, it would take 10 years of earnings at the current level to "earn back" the stock's price. A higher P/E ratio indicates the stock price is high relative to earnings, whereas a lower P/E indicates the price is low relative to earnings.
It's important to note that P/E can be derived on a per-share basis or using total values: dividing the company's market capitalization by its total net earnings yields the same result as price per share divided by EPS. The ratio is typically expressed as a simple number (e.g. 15, 20, 30), often without units. Analysts use this number as a quick gauge of valuation - how "expensive" or "cheap" a stock is relative to its profit.
Why P/E is important.
The P/E ratio is popular because earnings are a primary driver of stock value and the ratio is straightforward and widely understood. A high P/E generally suggests that investors expect higher earnings growth in the future (and are willing to pay a premium for it), while a low P/E might signal the stock is undervalued or that the company's prospects are bleak. There is no single "good" P/E number; what's high in one industry might be normal in another.
|
For context, the S&P 500's average P/E has often been in the mid-teens historically, though it can be much higher or lower at different times (in 2025, the S&P 500's forward P/E is around the low 20s, above its 10-year average) - indicating a relatively expensive market by historical standards. Always compare a company's P/E to its peers or industry rather than judging it in isolation. |
Trailing vs. Forward P/E: Understanding the Difference
Not all P/E ratios use the same earnings timeframe. Analysts typically rely on two versions: trailing P/E, which looks backward at actual earnings, and forward P/E, which looks ahead using projected earnings. Both provide valuable insight, but they serve different purposes and must be interpreted carefully.
|
Category |
Trailing P/E (TTM P/E) |
Forward P/E (Leading P/E) |
|
Definition |
Uses actual earnings from the past 12 months (trailing twelve months) as EPS in the denominator. Also called “current P/E.” |
Uses forecasted earnings for the next 12 months as EPS in the denominator. |
|
Example |
If a stock trades at $20 and last year's EPS was $1, the trailing P/E = 20. |
If a stock trades at $40 and next year's EPS is projected at $2, the forward P/E = 20. |
|
Strengths |
Objective, based on reported financials; comparable across companies with positive earnings. |
Forward-looking, incorporates growth expectations; useful for valuing growth companies or in times of change. |
|
Limitations |
Backward-looking; may not reflect future prospects, and distorted if earnings were unusual. |
Relies on analyst estimates that may be overly optimistic or uncertain. |
Which P/E Ratio Should You Use?
Analysts often prefer forward P/E when valuing growth stocks or during periods of rapid change, since current earnings might not reflect the future.
For example, if a company had an unusually bad year or a one-time loss, its trailing P/E could be sky-high (or not meaningful at all), but the forward P/E may show a more "normal" valuation assuming earnings recover.
In cases of significant corporate changes - say a major acquisition or a shift in leverage - forward P/E provides a better sense of value going forward. That said, forward P/E relies on earnings estimates, which can be overly optimistic or uncertain. It's not uncommon for analysts to overshoot or undershoot, so treat forward P/E as an informed guess.
Importantly, be consistent when comparing companies. Use trailing P/Es across a peer group or forward P/Es across the peer group, but not a mix. Comparing one stock's forward P/E to another's trailing P/E is an apples-to-oranges comparison that can mislead. The CFA curriculum emphasizes that for proper comparisons, analysts should use the same earnings basis for all stocks being compared.
Use Cases: How Analysts Use the P/E Ratio
The P/E ratio is a versatile tool in an analyst's toolkit. Here are some common use cases where junior analysts and associates will encounter and apply P/E ratios:
Comparing Companies (Relative Valuation).
Perhaps the most powerful use of P/E is comparing one company's valuation to that of peer companies or an industry average. Within the same sector (where businesses are similar), the P/E offers a quick way to see which stocks are priced higher or lower relative to their earnings.
For example, if Company A trades at 15x earnings and Company B trades at 30x earnings, Company B's stock is valued twice as richly in earnings terms. Is that justified by higher growth prospects or superior quality? Or might Company B be overvalued (or Company A undervalued)?
These questions form the basis of comparables analysis. Junior analysts often prepare comparable company analysis tables listing P/E ratios for a set of peers. If a target company's P/E is well below peers, it could be a sign of a bargain - or an indication of some risk the market sees. Conversely, a much higher P/E than peers could imply the market expects exceptional growth or is overpaying for the stock.
Example Comparable Company Analysis Table:
|
Company |
Share Price |
EPS (TTM) |
P/E Ratio |
Notes |
|
Company A |
$45 |
$3.00 |
15x |
Trading below peer average; could be undervalued or reflect market concerns. |
|
Company B |
$120 |
$4.00 |
30x |
Priced at a premium; market may be expecting faster growth or superior quality. |
|
Company C |
$80 |
$5.00 |
16x |
Close to industry average; relatively stable valuation. |
|
Industry Average |
- |
- |
20x |
Benchmark for assessing whether individual companies are cheap or expensive. |
Example Insight: In this mock group, Company B is valued at 30x earnings, well above the 20x industry average, suggesting high expectations or potential overvaluation. Company A, at 15x, trades at a discount to peers—possibly a bargain if risks are manageable.
Example Peer Comparison Table:
|
Company |
P/E Ratio |
vs. Industry Average (20x) |
|
Company A |
15x |
-5x (below average) |
|
Company B |
30x |
+10x (above average) |
|
Company C |
16x |
-4x (below average) |
|
Industry Average |
20x |
- |
Example Insight: This format highlights the relative valuation directly. Company B trades at a significant premium to peers, while Companies A and C are below average, potentially indicating undervaluation or higher perceived risk.
Historical Valuation Trends.
Analysts also look at a company's own P/E history. How does the current P/E compare to its historical range? Many companies tend to trade in a band of P/E ratios over time (adjusted for economic cycles).
If a stock's P/E is at the low end of its 10-year range, it might be undervalued relative to its past - unless something fundamental changed. If it's at a record high P/E, the stock could be priced for perfection.
For instance, during market bubbles (like the dot-com era), average P/Es shot well above historical norms, serving as a warning sign. Tracking the P/E over time, especially the trailing P/E, can help identify if the current sentiment is overly pessimistic or optimistic.
Quick Estimation of Fair Value.
The P/E ratio can be used to derive a quick fair price estimate for a stock. If you determine from peer analysis or historical averages that a reasonable P/E for a company is 20, and you know the company's EPS is $5, you might estimate a fair stock price around $5 × 20 = $100.
This is essentially using P/E in reverse to value the stock (Price = P/E × Earnings). This approach is common in equity research for a sanity check. For example, analysts might say "This stock earns $3 per share and similar companies trade at 15x, so it should be worth ~$45 if fairly valued." Keep in mind this is a starting point - you would further refine with growth, risk, and other factors - but it's a handy shortcut for valuation.
Investment Screening.
Junior analysts might screen stocks by P/E to identify potential opportunities. For instance, a screen for stocks with P/E below a certain threshold (e.g. P/E < 10) might surface companies that the market has left behind (possible value stocks). Likewise, screening for high P/E stocks might highlight companies priced for growth. In either case, those become candidates for deeper analysis. The P/E alone doesn't make the decision, but it helps narrow the field.
Understanding Market Expectations.
P/E can tell you what the market expects.
- A very high P/E implies the market is expecting high earnings growth (or some significant positive outlook) - investors are effectively willing to pay now for earnings to come later.
- A very low P/E might indicate the market sees trouble ahead (or simply that a sector is out of favor).
By comparing forward and trailing P/Es, you can gauge whether growth is expected. For example, if a company's trailing P/E is 50 but forward P/E is 25, the market expects earnings to roughly double next year. As an analyst, you'd investigate whether those expectations are realistic.
Finally, it's worth noting that P/E is just one measure. Professional analysts often use it alongside other valuation multiples (like Price-to-Book, Price-to-Sales, EV/EBITDA, etc.) to get a fuller picture.
For instance, banks are often valued by P/B, startups by P/S, and highly levered companies by EV/EBITDA. Each multiple has its rationales and drawbacks - as the CFA curriculum notes, a key drawback of P/E is that differences in accounting or one-time items can make comparisons difficult. Thus, P/E should be part of a holistic analysis, not the sole determinant.
Fetching P/E Data in Practice (API Example)
To effectively use P/E in analysis, you need accurate earnings and price data. Financial Modeling Prep's Financial Ratios API simplifies this by providing ready-made P/E ratio data for thousands of companies. Rather than manually calculating P/E from financial statements, an analyst can pull the latest P/E (along with other ratios) via a simple API call. This is especially useful when comparing many companies or updating data in real time.
For example, the FMP Ratios API endpoint for Apple (AAPL) returns a JSON response containing various financial ratios, including the P/E ratio. Here's a snippet of what that data might look like:
[
{
"symbol": "AAPL",
"date": "2024-09-28",
"priceToEarningsRatio": 37.287278415656736,
"priceToSalesRatio": 8.93822887866815,
…
}
]
In this JSON, priceToEarningsRatio is Apple's P/E (approximately 37.29). The data includes other valuation metrics like Price/Sales as well. Financial Modeling Prep computes these ratios based on the latest financial statements and market prices.
For developers, fetching this data is straightforward. Below is a beginner-friendly JavaScript example using the Fetch API to get Apple's P/E ratio:
const symbol = "AAPL";
const apiKey = "YOUR_API_KEY";
const url = `https://financialmodelingprep.com/stable/ratios?symbol=${symbol}&apikey=${apiKey}`;
fetch(url)
.then(response => response.json())
.then(data => {
const peRatio = data[0].priceToEarningsRatio;
console.log(`${symbol} P/E ratio: ${peRatio.toFixed(2)}`);
})
.catch(error => console.error("Error fetching data:", error));
This code constructs the API URL with the desired ticker and your API key, then retrieves the JSON data. We access data[0].priceToEarningsRatio from the returned array (in this case, the array has one object for AAPL) and log it.
A similar approach can be used in Python (using requests library) or any other language. In fact, one Medium reviewer noted that FMP's API provides "a variety of data, from real-time stock prices to comprehensive financial statements", making it a one-stop shop for developers building finance tools.
For non-developers, you can still fetch and use this data easily. One option is to simply use your web browser: paste the API endpoint URL (with your API key) into a browser, and you'll see the data in JSON format. It won't be pretty formatted, but you can search within it for the "priceToEarningsRatio" value.
Another option is to use tools like Postman or API clients, which provide a more user-friendly view of JSON data. If you prefer Excel or Google Sheets, FMP offers an Excel Add-in and Google Sheets integration - you could call the API directly from a spreadsheet formula or use their add-in to pull P/E ratios into your analysis spreadsheet without writing code.
The key is that with FMP's Ratios API, the heavy lifting is done for you: instead of manually looking up earnings and calculating P/E, you get the latest figure on demand. This lets you spend more time interpreting the numbers and less time gathering them.
From Theory to Practice: P/E Mini-App Powered by FMP
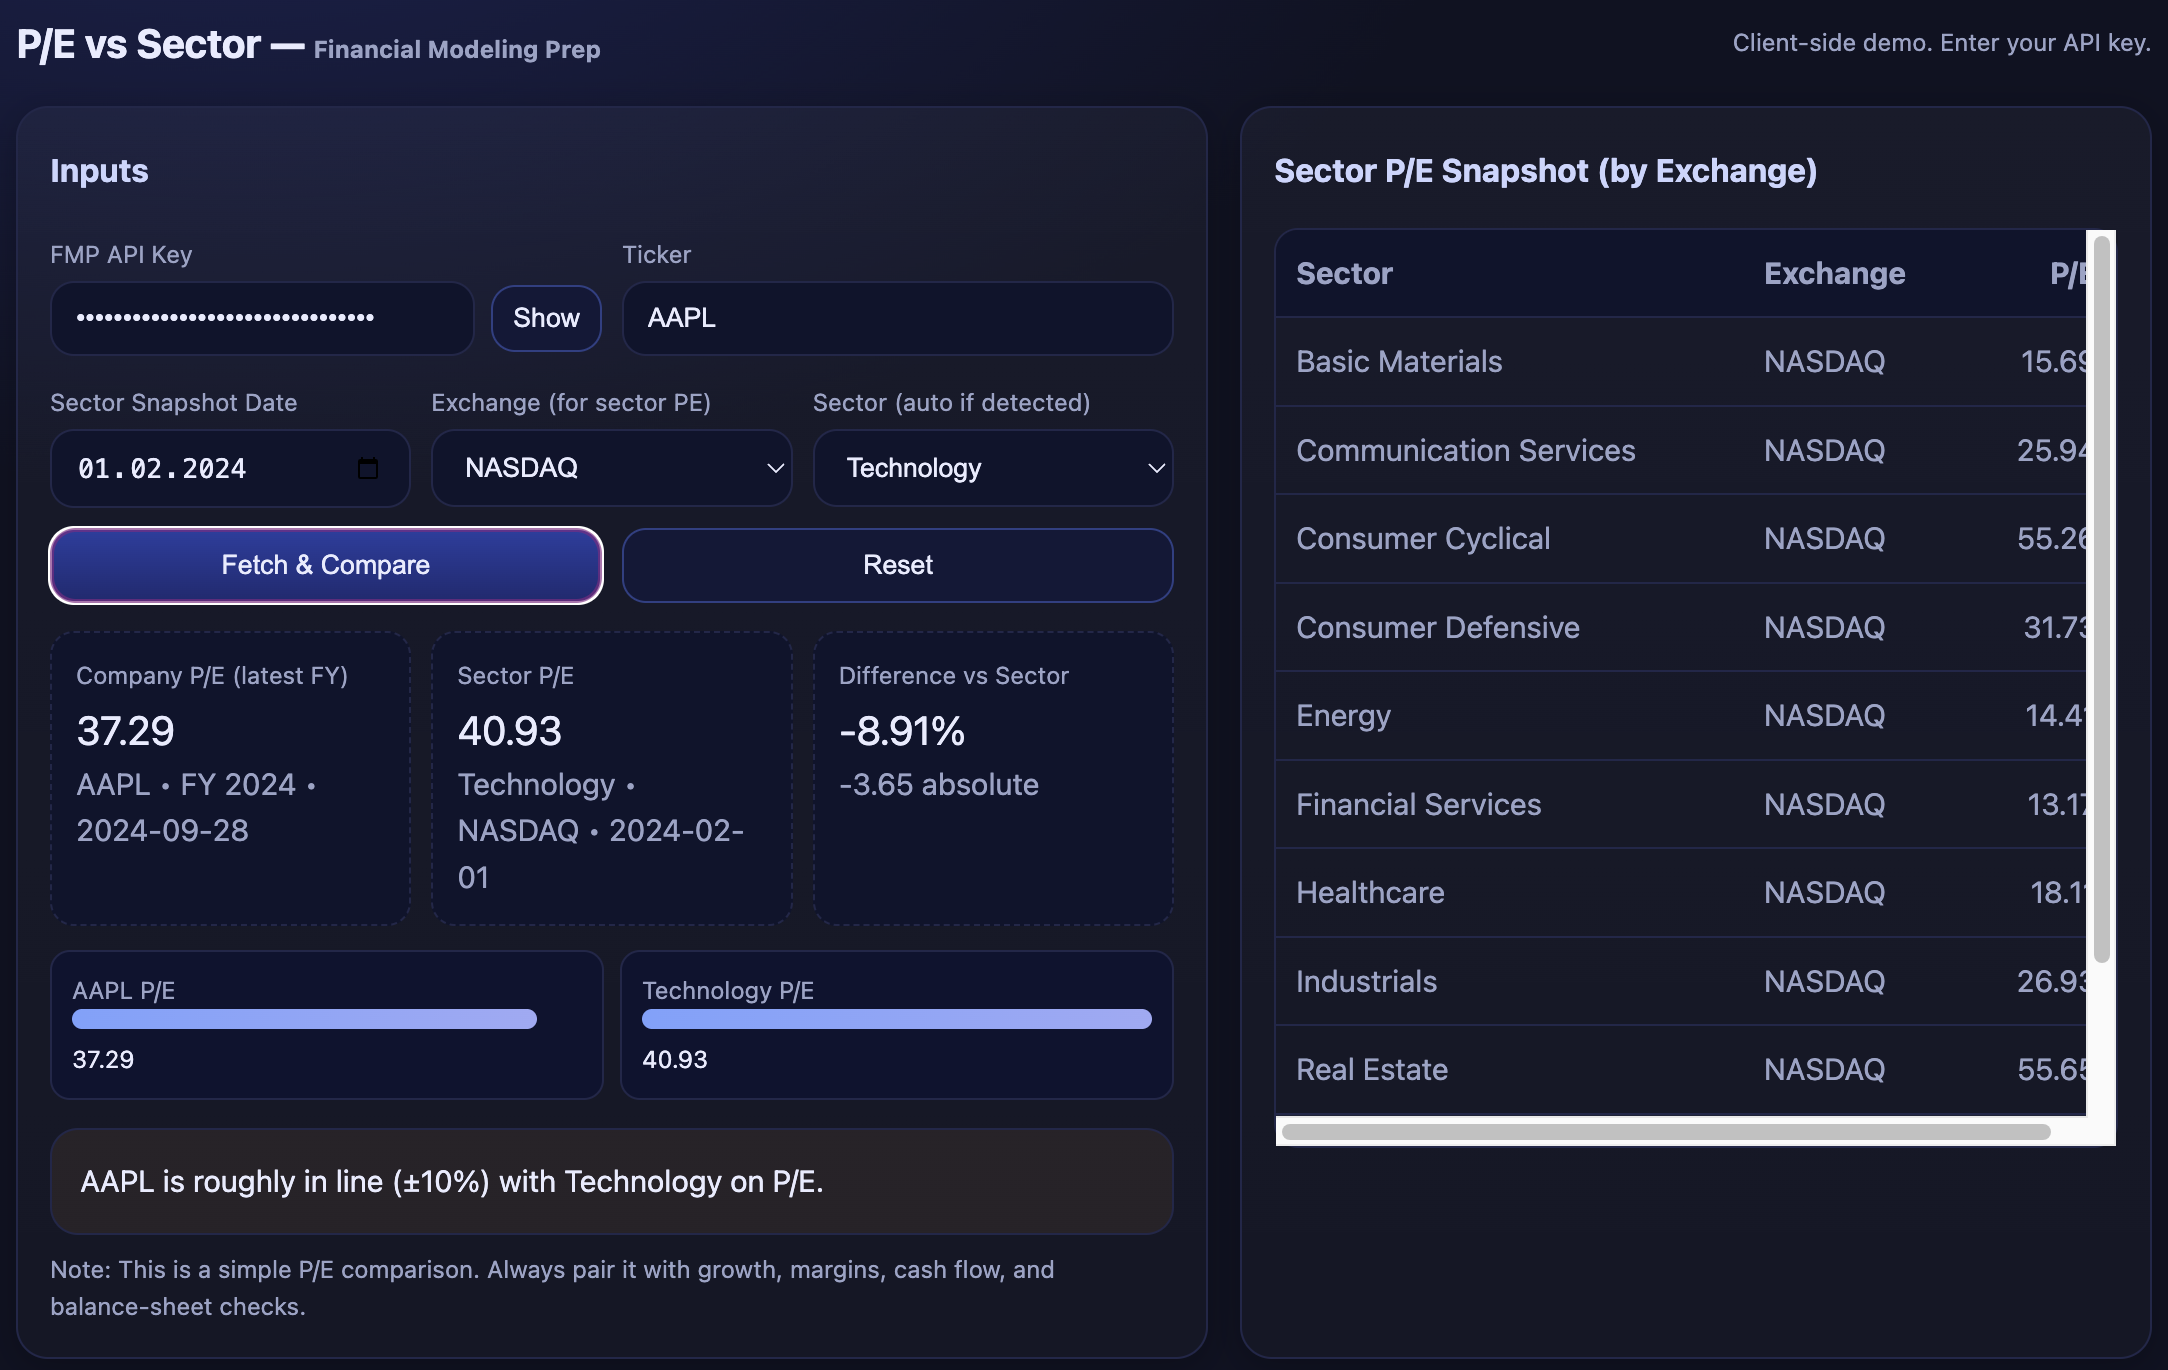
To put the price to earnings (P/E) framework into practice, I built a single-file web app “PE-to-Sector” that lets you enter a ticker and instantly pull its latest P/E from FMP's Financial Ratios API. The tool also fetches sector P/E via the Sector PE Snapshot for your chosen date and exchange, auto-detecting the company's sector through the Company Profile endpoint. The UI surfaces the essentials—company P/E, sector P/E, and the percentage gap—with clean comparison bars and a clear verdict: potentially undervalued, overvalued, or roughly in line (±10%). Just remember to replace the placeholder with your own custom FMP API key before fetching data.
Common Pitfalls and Misuses of P/E
Despite its popularity, the P/E ratio has important limitations. As a junior analyst, it's crucial to be aware of these pitfalls so you don't misinterpret the numbers or use them incorrectly:
Negative or Zero Earnings.
A P/E ratio requires a positive earnings number in the denominator. If a company has negative earnings (a loss) or zero earnings, the formula results in a negative or undefined P/E. Such values do not make economic sense.
In practice, you will see "N/A" (not applicable) for companies with negative EPS. Be careful comparing a profitable company's P/E to another company that currently has no earnings - the latter simply can't be evaluated by P/E. In these cases, analysts may use alternative metrics (like Price-to-Sales or enterprise value ratios) until the company becomes profitable.
One-Time Earnings Distortions.
Earnings can be affected by unusual items - for example, a one-time gain from selling a division, or a large write-off in an bad year. These anomalies can spike or sink the EPS, and thus skew the P/E. A company might look extremely expensive on P/E because earnings were temporarily low due to an extraordinary charge, or deceptively cheap because of a one-off gain.
It's important to adjust for non-recurring items to get a meaningful P/E. The CFA curriculum suggests using normalized earnings (an average over a business cycle or an adjusted earnings figure) when a single period's EPS is not representative. In practice, analysts often calculate an adjusted P/E excluding one-time items to compare ongoing performance. Always ask: "Are these earnings a true reflection of ongoing profitability?"
Accounting Differences.
Earnings are subject to accounting policies and estimates. Companies have leeway in how they recognize revenue, depreciation, etc. These differences can make P/Es difficult to compare across companies, even in the same industry.
For example, differing accounting standards or practices (GAAP vs. IFRS) might mean that two companies with the same economic reality show different EPS. Thus, P/E isn't a pure apples-to-apples metric unless you're confident the earnings quality and accounting are comparable. This is another reason to look at other metrics alongside P/E.
Ignoring Growth (The Growth Trap).
Perhaps the biggest limitation of P/E is that it says nothing about earnings growth rates. A company growing earnings 30% a year could justify a high P/E, while a company with stagnating earnings might deserve a low P/E. If you look only at the raw P/E, you might think a stock with P/E 40 is "overvalued" compared to one with P/E 10.
But if the high P/E company is growing dramatically, and the low P/E company is shrinking, the opposite could be true. P/E must be interpreted in context of growth. To address this, analysts use the PEG ratio (Price/Earnings to Growth ratio), which is P/E divided by the earnings growth rate, to factor growth into the valuation.
For example, a company with P/E 40 and growth 40%/year has a PEG of 1, which might be quite reasonable, whereas a company with P/E 10 and zero growth has an infinite PEG - possibly not a bargain at all. A high P/E might simply indicate high expected growth rather than overvaluation, and a low P/E can be a value trap if the company has poor prospects. Always correlate P/E with the company's growth story and outlook.
Mastering the P/E Ratio
The Price-to-Earnings ratio is a fundamental tool that junior analysts and associates will use frequently to evaluate stocks. It offers a lens into how the market values a company's profits and is invaluable for comparing companies and gauging expectations. The P/E ratio is simple but not simplistic - it must be applied thoughtfully. Always ensure you're comparing like with like (consistent earnings basis, similar companies), and use P/E alongside other metrics to cross-check conclusions. A high P/E doesn't automatically mean "sell," and a low P/E doesn't automatically mean "buy"; you have to dig into why the ratio is high or low. By understanding what goes into the P/E and what external factors influence it, you'll avoid common mistakes and make more credible, data-driven recommendations.
As you incorporate P/E into your analysis, remember to leverage tools that make your job easier. For instance, you can seamlessly pull real-time P/E and other ratios using FMP's Financial Ratios API and get forward-looking earnings data from the Financial Estimates API - this combination lets you analyze both trailing and forward P/E with ease. By mastering the P/E ratio and its nuances, you'll be well-equipped to assess whether a stock's price is justified by its earnings and to communicate your findings with the confident, professional voice that the industry expects.
FAQs
What is a good P/E ratio?
There is no single "good" P/E ratio that applies to all companies. What's considered high or low depends on the industry and the company's growth prospects. For example, a P/E of 30 might be normal for a tech company growing quickly, but very high for a utility company with slow growth. It's best to compare a stock's P/E to the P/E of similar companies (peers) or to its own historical P/E range. In general, a lower P/E than peers could signal undervaluation (or lower expected growth), while a higher P/E could signal overvaluation (or higher expected growth). Always consider the context: growth rates, risk, and industry norms. As a rule of thumb, the average market P/E (for the S&P 500) has historically been around 15-20, but it fluctuates over time.
How do you calculate the P/E ratio?
To calculate P/E, you divide the current share price by the earnings per share (EPS). EPS can be found on a company's income statement (net income divided by number of shares). For example, if a stock trades at $50 and its EPS over the last 12 months was $5, the P/E = $50 / $5 = 10. This means the stock is trading at 10 times its earnings. If using forward P/E, you would use expected EPS for the next year instead of historical EPS. Remember that if EPS is negative, P/E is not meaningful.
What's the difference between trailing P/E and forward P/E?
Trailing P/E uses the actual earnings from the past 12 months (trailing twelve months, or TTM). It tells you the price relative to what the company has earned recently. Forward P/E uses forecasted earnings for the next 12 months (or next fiscal year). It tells you the price relative to what the company is expected to earn in the future. Trailing P/E is backward-looking and based on hard data, while forward P/E is forward-looking but based on analysts' estimates (which could be wrong).
Can the P/E ratio be negative or not applicable?
If a company has negative earnings (a loss) or zero earnings, the P/E formula results in a negative or undefined number. In these cases, you'll often see P/E listed as "N/A" (not applicable) because a negative P/E isn't meaningful - it doesn't make sense to say a stock is trading at -10 times its earnings. For practical purposes, companies with no earnings cannot be evaluated by P/E. Analysts will use other measures (like Price-to-Sales, or look at forward earnings if the company is expected to turn profitable).
Is a high P/E ratio always bad?
Not necessarily. A high P/E means a stock's price is high relative to earnings - which often implies that investors expect high future growth. Many excellent companies trade at high P/Es because the market believes in their growth potential or competitive advantages. For example, a company consistently growing earnings 20%+ per year might have a high P/E and still deliver strong future returns if that growth materializes.
A high P/E is “bad” if it's not backed by strong prospects - for instance, if a company has a high P/E but low growth and some business risks, it might be overvalued. Always investigate why the P/E is high. Sometimes it might reflect intangibles like strong brand or market dominance, sometimes it's just hype. Use other tools (like the PEG ratio, which accounts for growth) to differentiate the two cases.

How an Economic Moat Provides a Competitive Advantage
Introduction In the competitive landscape of modern business, companies that consistently outperform their peers ofte...

Apple’s Slow Shift from China to India: Challenges and Geopolitical Risks
Introduction Apple (NASDAQ: AAPL) has been working to diversify its supply chain, reducing dependence on China due to...

Taiwan Semiconductor Manufacturing Company (NYSE: TSM) Surpasses Earnings Expectations
Taiwan Semiconductor Manufacturing Company (NYSE: TSM) is a leading player in the global semiconductor industry. Known f...