FMP
FMP API Viewer: Analyze Financial Statements and Stock Performance
Aug 19, 2025 3:14 PM - Sanzhi Kobzhan


Image credit: FMP API Viewer
Tired of switching between spreadsheets and websites for stock research? Meet the FMP API Viewer. The Financial Modeling Prep (FMP) API Viewer is an interactive web tool that consolidates company financial statements, market data, and analytics into one place. It gives retail investors, executives, financial analysts, and developers a code-free way to retrieve financial data and stock performance metrics instantly.
In this tutorial-style guide, we'll explore how this no-code platform works and how you can use it to streamline your investment research and company analysis, from digging into balance sheets to charting stock trends - all with just a few clicks.
Why Use the FMP API Viewer?
The FMP API Viewer (also known as the FMP Playground) is a one-stop interface for financial data analysis. It allows users to select a stock ticker, pick the specific dataset they need, and export the results in various formats - without writing a single line of code. This means you can skip the usual hassle of juggling multiple sources or manual data entry.
Here are some key benefits and use cases:
Comprehensive Data Access
FMP's platform covers over 70,000 stocks with up to 30 years of historical data, including real-time prices, fundamentals, technical indicators, and news. Every API endpoint - from historical price series to the latest financial news - is available through the API Viewer's intuitive interface. This breadth of data ensures that you have all the information needed to evaluate a company's financial health and market performance in one place.
User-Friendly
The API Viewer lets you tailor data selection to your needs. You can easily choose specific datasets (income statements, price history, or financial ratios) for any stock. Simply pick the data category from the sidebar and adjust parameters (like period or date range) - no special skills required. The tool will fetch the latest data for you with minimal effort. FMP simplifies access to reliable financial data, saving time on manual data collection, which is crucial to analyze companies quickly.
Multiple Export Options
After retrieving the data, the Viewer makes it easy to download your results. With a click of the Export button, you can save data as JSON (for programming or apps), CSV (for Excel/Google Sheets), or plain text for quick reference. This flexibility means you can seamlessly move the analysis to your own spreadsheet or integrate it into reports. For example, an executive could export a company's financials to CSV and hand it off to the finance team for further modeling.
Accessible for All User Levels
Whether you're a newcomer to financial data or a tech-savvy analyst, the FMP API Viewer's interface is straightforward and efficient. Beginners benefit from its point-and-click simplicity (no coding or API syntax to learn), while experienced analysts and developers appreciate the quick data previews and consistent formatting across endpoints. In fact, many users have found FMP to be “an all-in-one financial API” that replaced the need for multiple services. It's a potent tool for anyone looking to make data-driven decisions confidently.
Who can benefit?
- Retail investors can quickly vet a stock's fundamentals and price history without digging through SEC filings.
- Executives can benchmark their company against competitors by pulling financial metrics on the fly.
- Financial analysts can rapidly gather inputs (financials, ratios, etc.) for models, speeding up the research process.
- Developers can use the Viewer to explore endpoints and prototype ideas before coding.
In short, if you need financial data, the FMP API Viewer likely has you covered in a convenient, code-free format.
Analyzing Financial Statements in a Few Clicks
Understanding a company's financial statements is critical for evaluating its performance. The FMP API Viewer makes financial statement analysis remarkably efficient. You can retrieve a firm's income statements, balance sheets, and cash flow statements in seconds - data that investors and analysts traditionally pull from lengthy reports.
Here's how you can drill into the fundamentals using the Viewer:
Step 1. Choose a Financial Statement.
After opening the API viewer, on the left sidebar, navigate to Statements. Under this category, you can pick the specific statement or report you need. For instance, click Income Statement to view Apple's revenue, profit, and expenses over time, or Balance Sheet for assets and liabilities. The Viewer will fetch the latest statement data (audited and standardized) for the periods available. You can typically toggle between annual and quarterly data as needed.
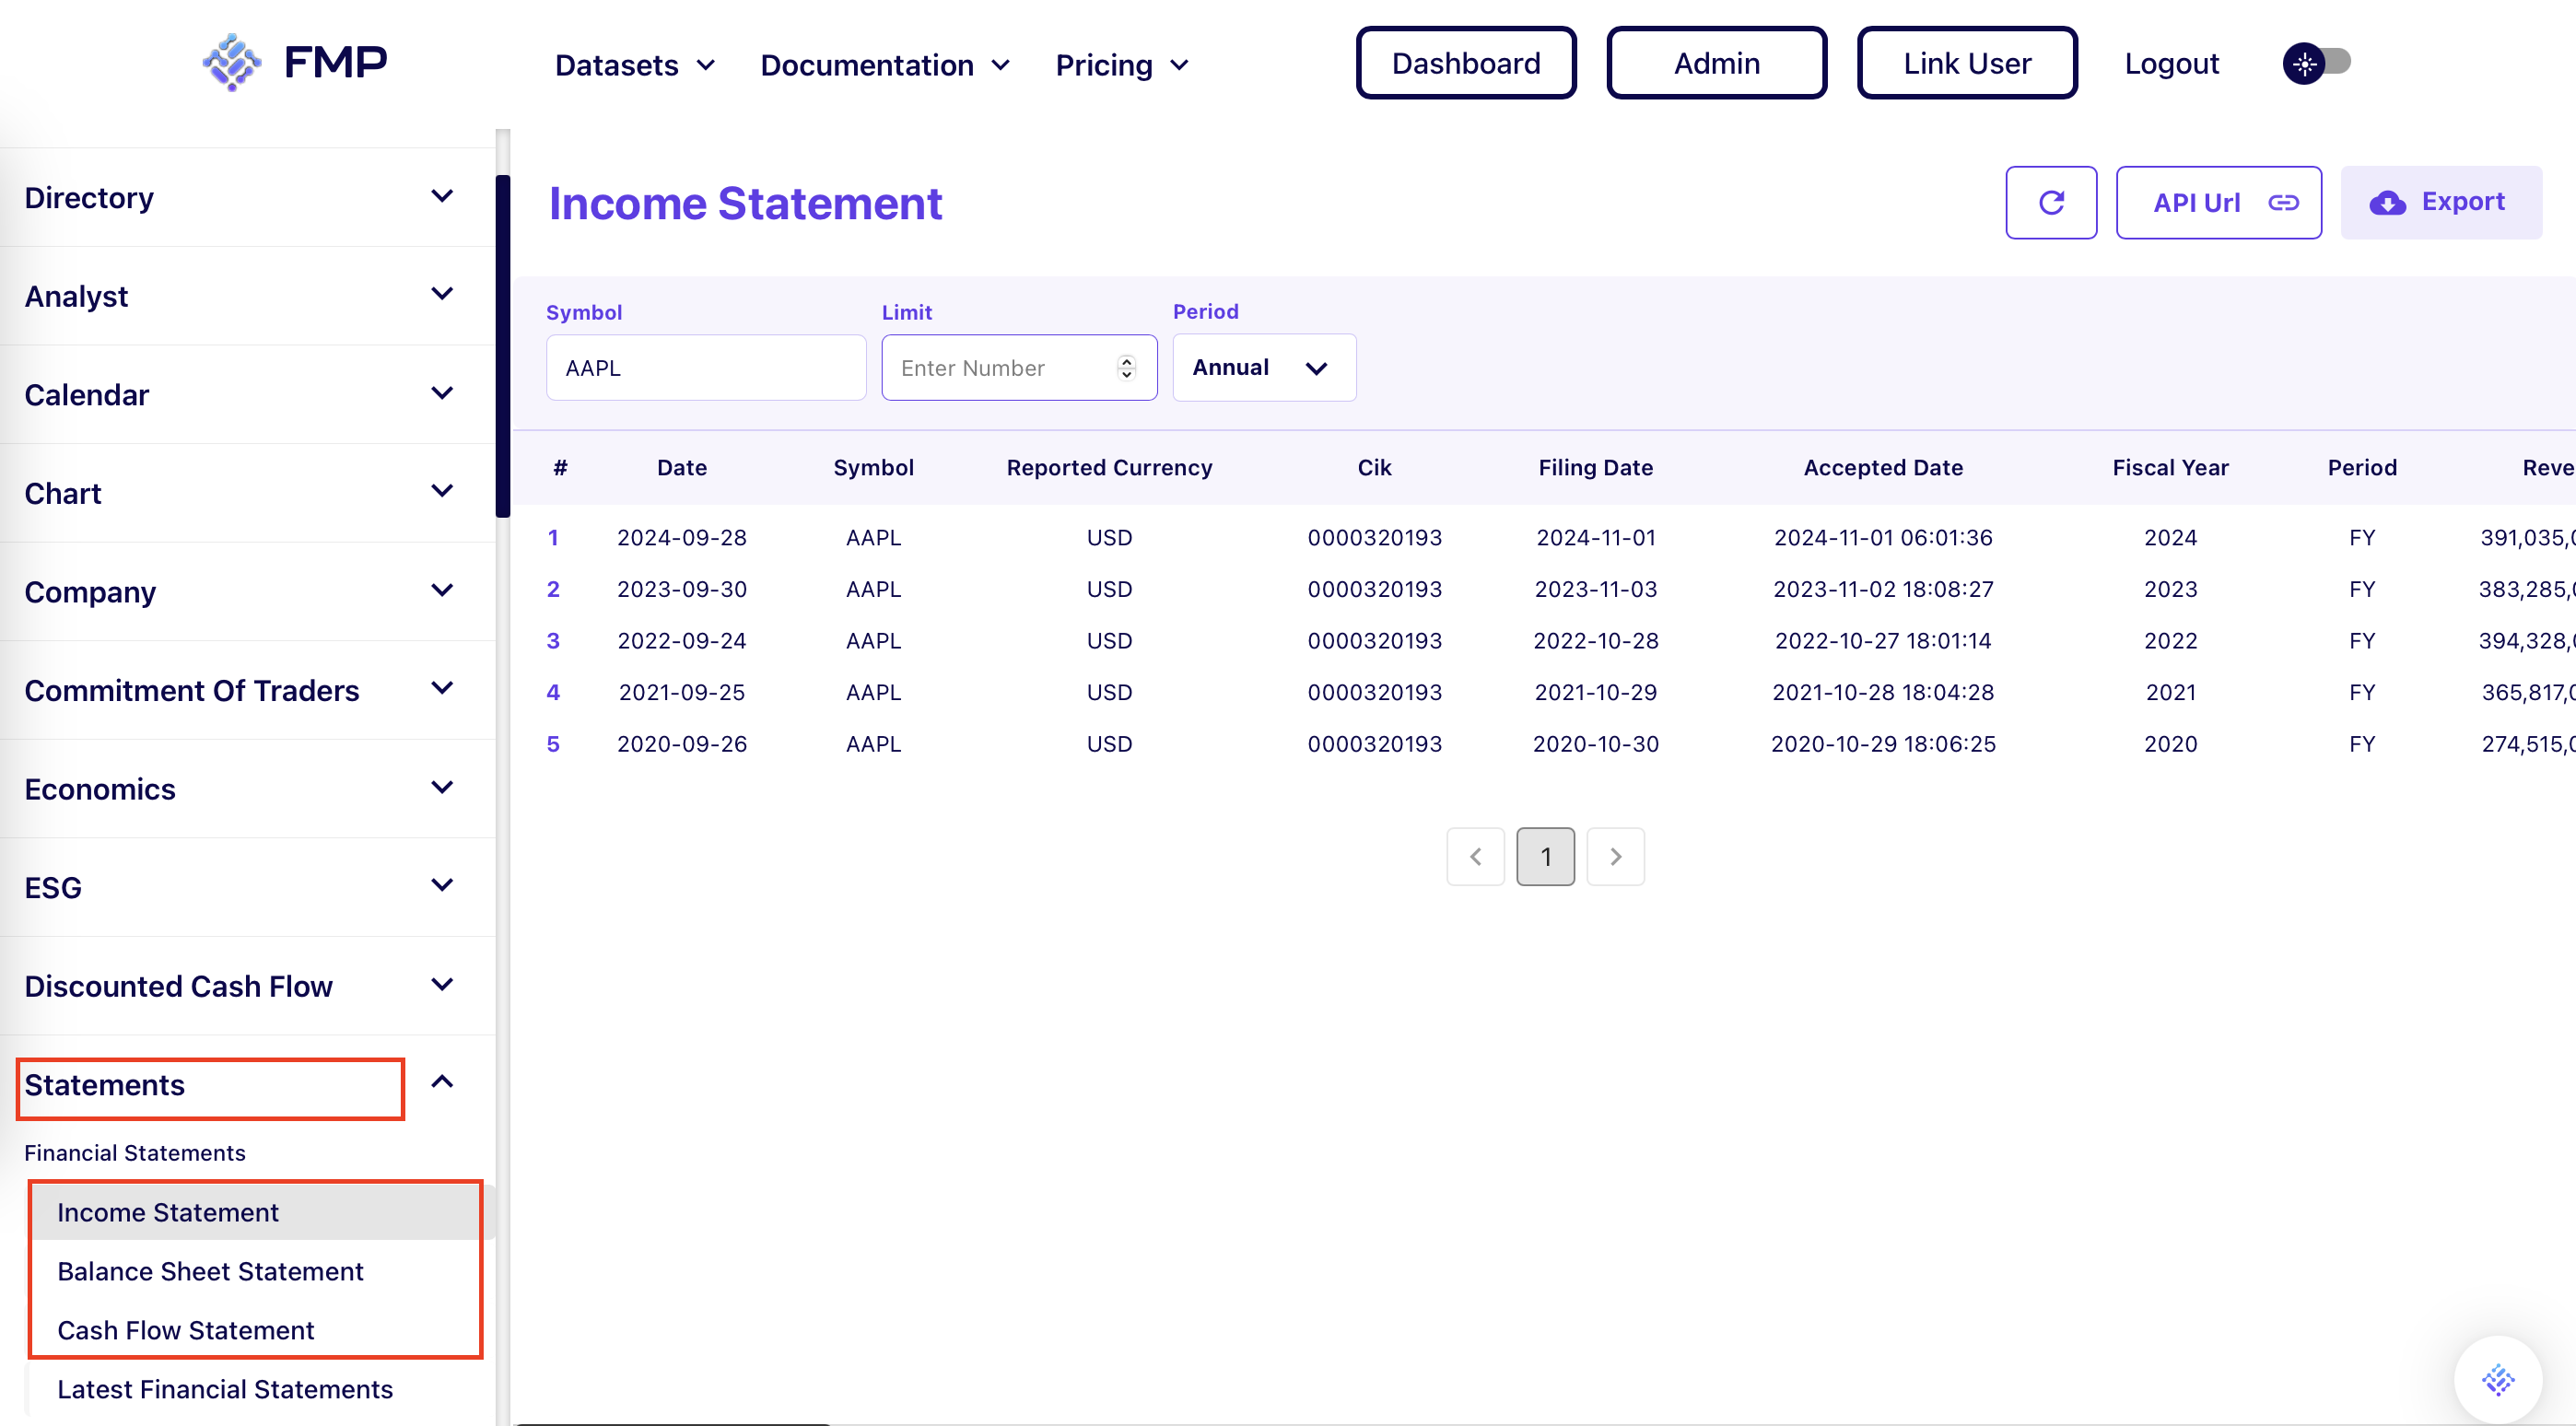
Step 2. View or Refine the Data.
Once selected, the statement data appears in the main panel. You'll see multiple periods of data (dates, figures for each line item) presented in a clean format - no spreadsheets or 10-K PDFs needed. The endpoint allows parameters like a period and number of periods, you can adjust those in the interface (e.g. request the last 5 years of data). The API Viewer essentially constructs the query for you. For example, to get quarterly financials, you would select the Quarter as a period before hitting apply.
Step 3. Extract and Export.
With the financial data on screen, you can immediately glean insights - for instance, noticing revenue growth or debt levels - or you can export it for deeper analysis. Hitting the Export button (top-right) lets you download the statement in CSV for Excel analysis, JSON for programming, or a simple text file. Many analysts export to Excel, where they can perform custom calculations or merge the data with other sources.
Expert Tip: FMP also offers an Excel/Google Sheets add-on for live data in spreadsheets, but even without it, the CSV export makes getting data into Excel trivial.
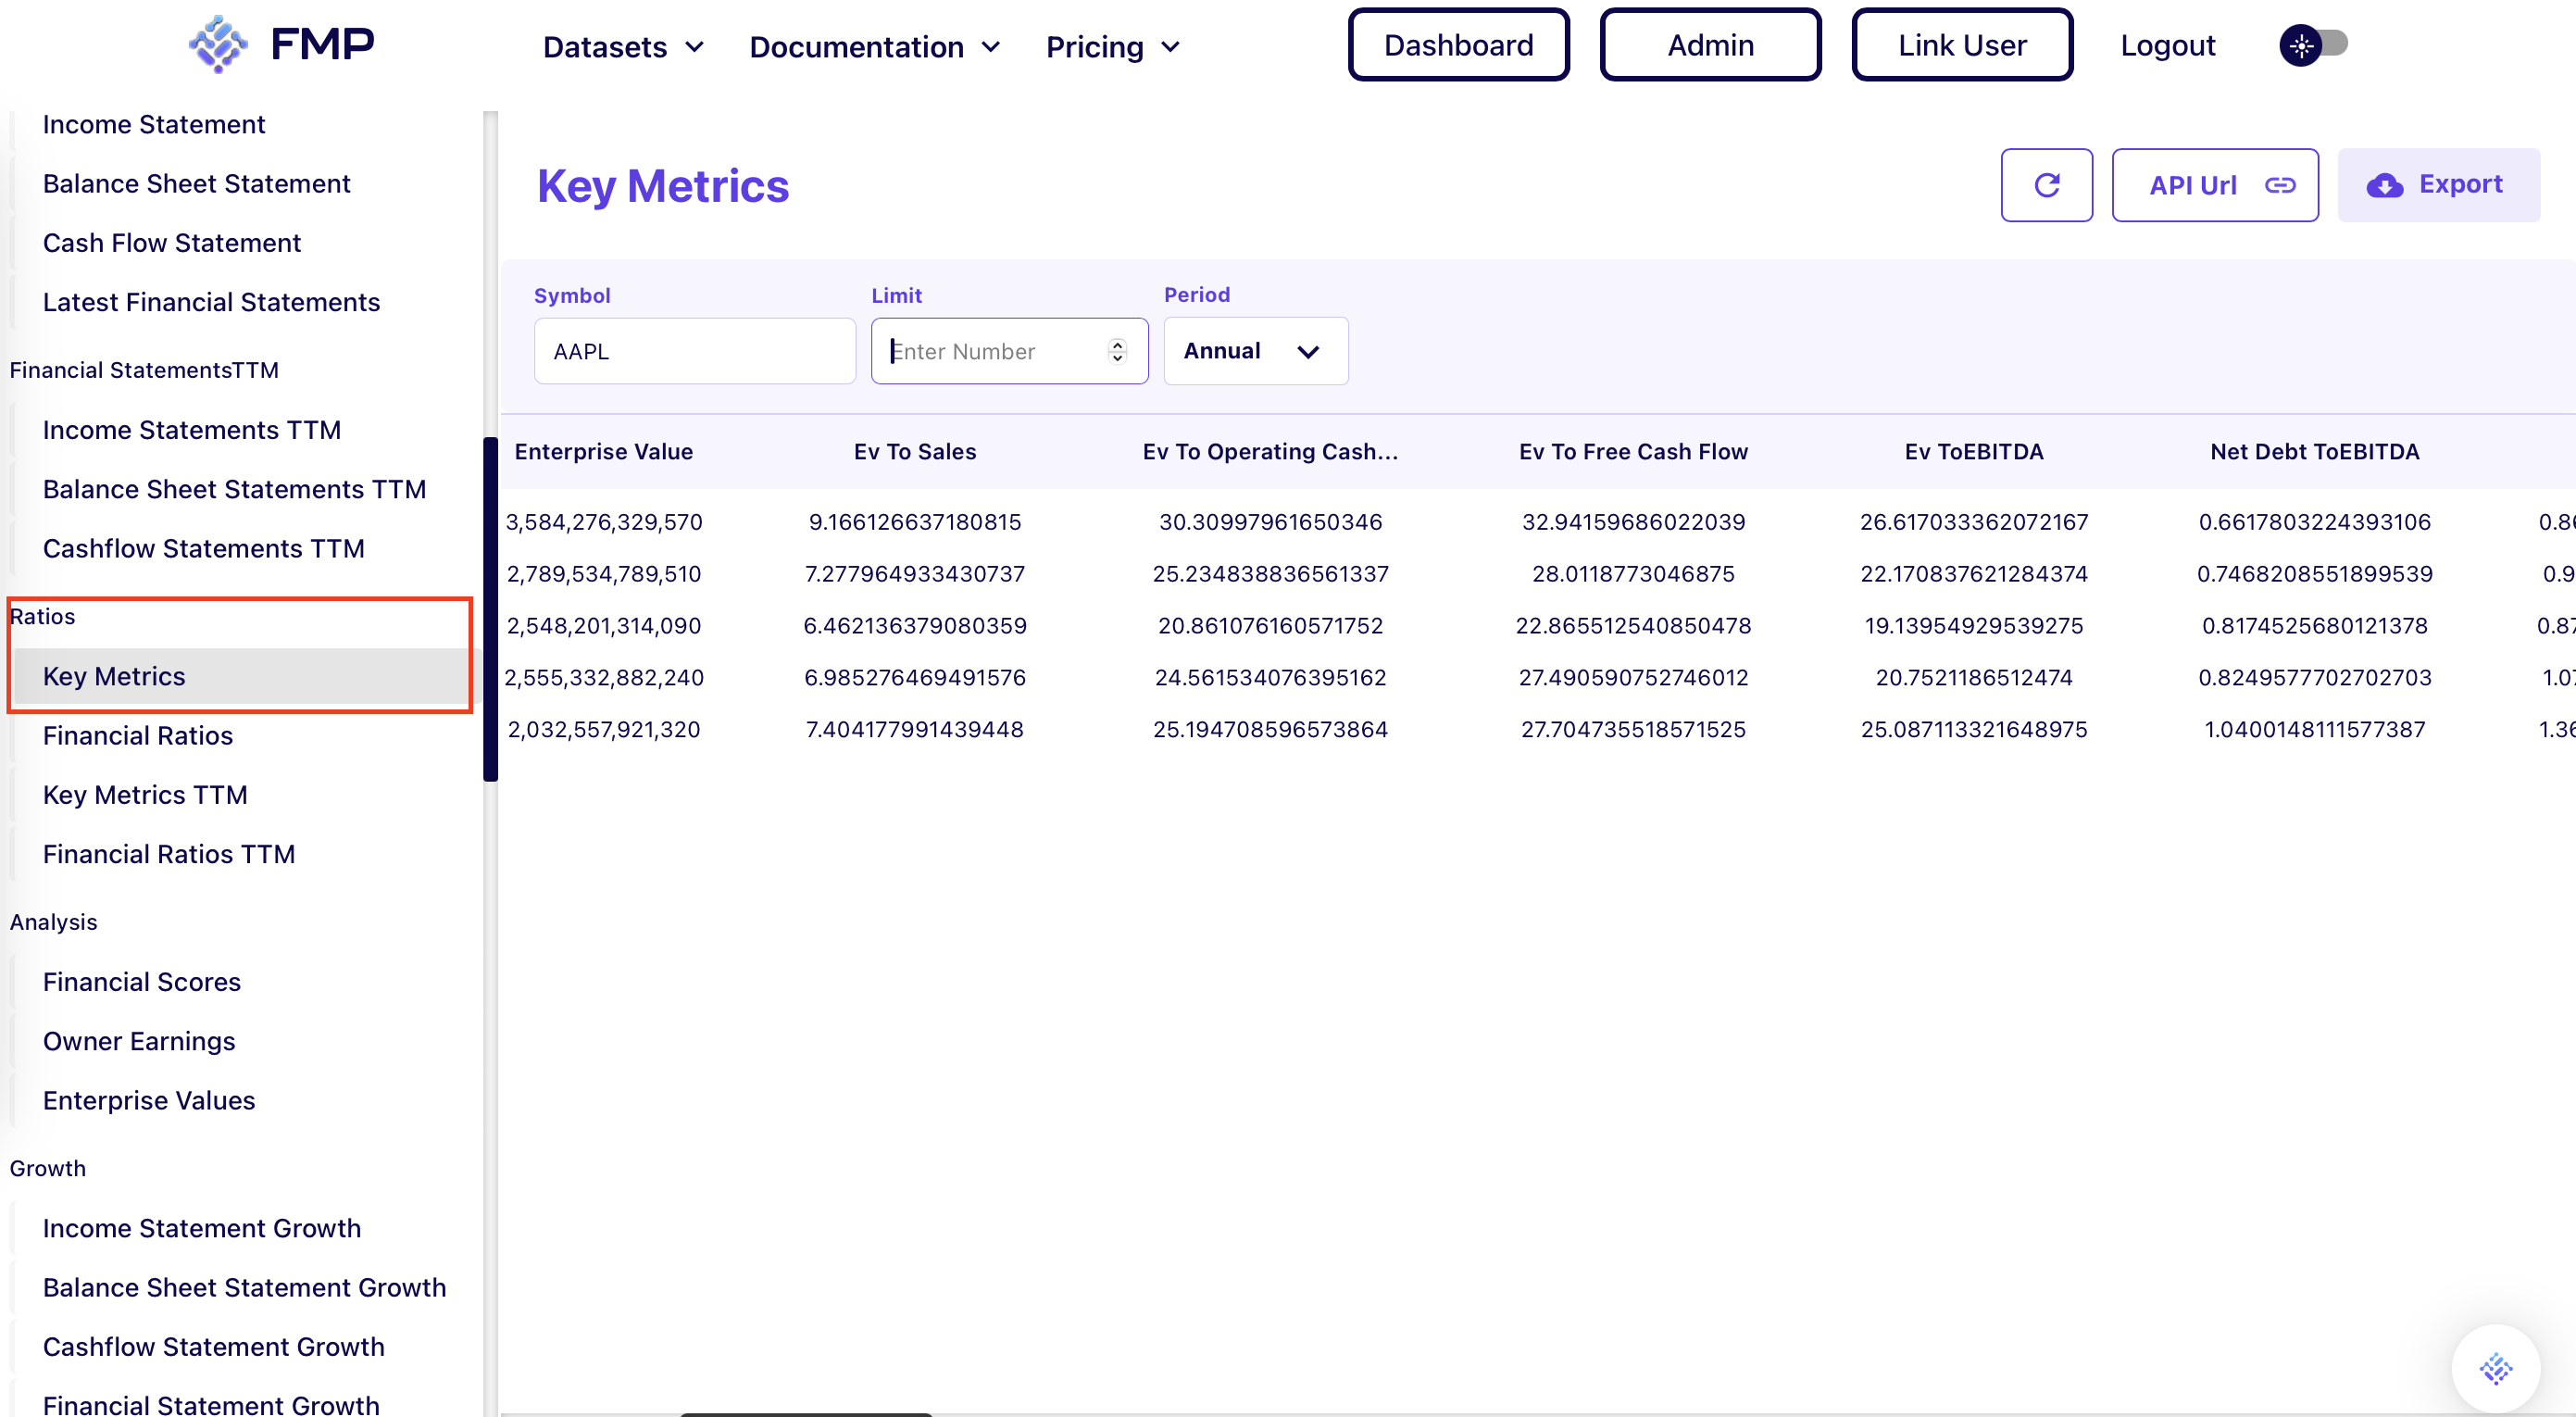
Using the API Viewer for fundamentals means you can get an updated snapshot of a company's financial health on demand. For example, an investor could compare key ratios like profit margins or return on equity by quickly grabbing the latest data via the Ratios endpoint - no manual ratio calculation required. The data is pulled directly from reliable sources (e.g. SEC filings), so you're analyzing the same numbers executives and institutional investors use. In practice, this empowers you to do thorough fundamental analysis (like checking if a company's earnings are growing or if its debt is manageable) much faster. Turning raw financial statements into insights with ratio analysis and trends is how investors decide if a company is worth buying into - and the Viewer helps you do exactly that, in a fraction of the time.
Assessing Stock Performance and Market Trends
Beyond fundamentals, investors need to evaluate how a stock is performing in the market. The FMP API Viewer shines here as well, enabling quick analysis of stock price history, trends, and other market data. Instead of hopping between charting websites, you can use the Viewer to pull historical prices, technical indicators, and even analyst sentiment in one interface.
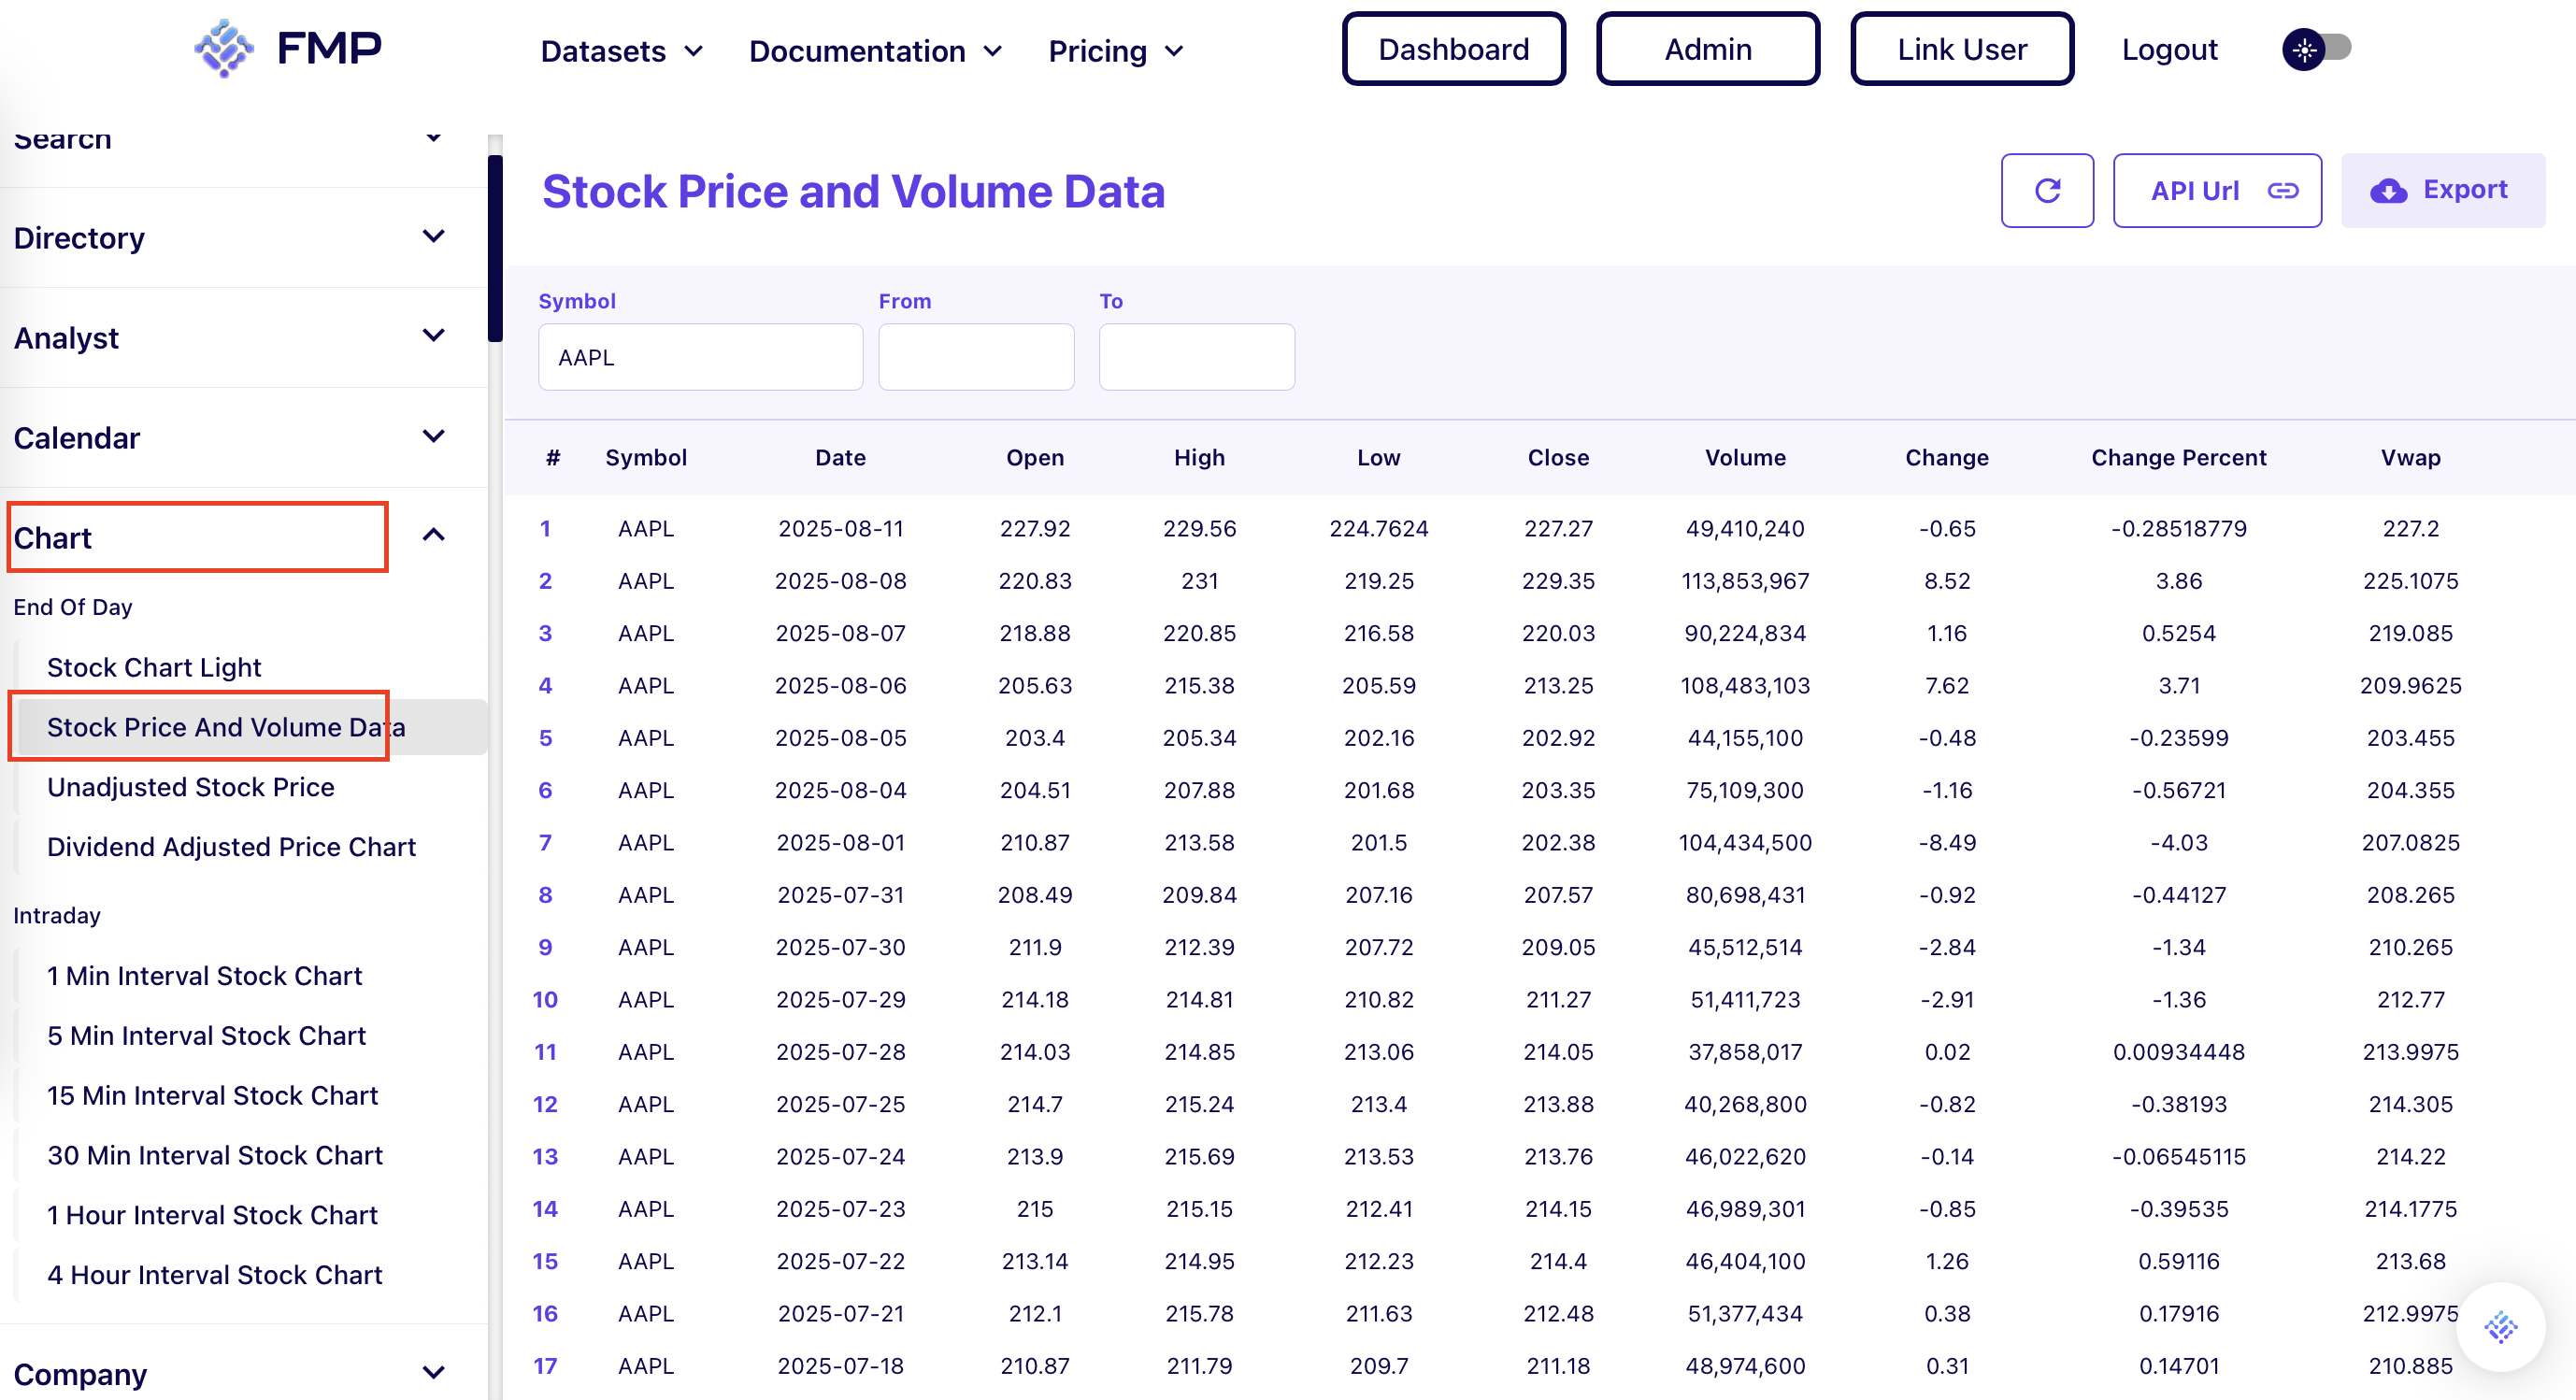
Historical Price Data.
To examine a stock's price trend, use the Stock Price And Volume Data in the Charts tab as shown in the below image. Input your ticker (say, AAPL) and specify the date range. With one click, the tool will display the daily open-high-low-close (OHLC) prices for that period. This is perfect for seeing how a stock has trended over years or during specific market cycles.
Quick Trend Analysis
The Viewer also supports technical analysis by providing technical indicators without any coding. On the sidebar, find Technical Indicators and choose an indicator like Exponential Moving Average (EMA) or Relative Strength Index (RSI). For instance, select EMA, set the parameters (interval, period, etc.), and hit apply - you'll get the EMA values computed on the stock's price data. This can help gauge momentum or trend strength at a glance.
Analyst Targets
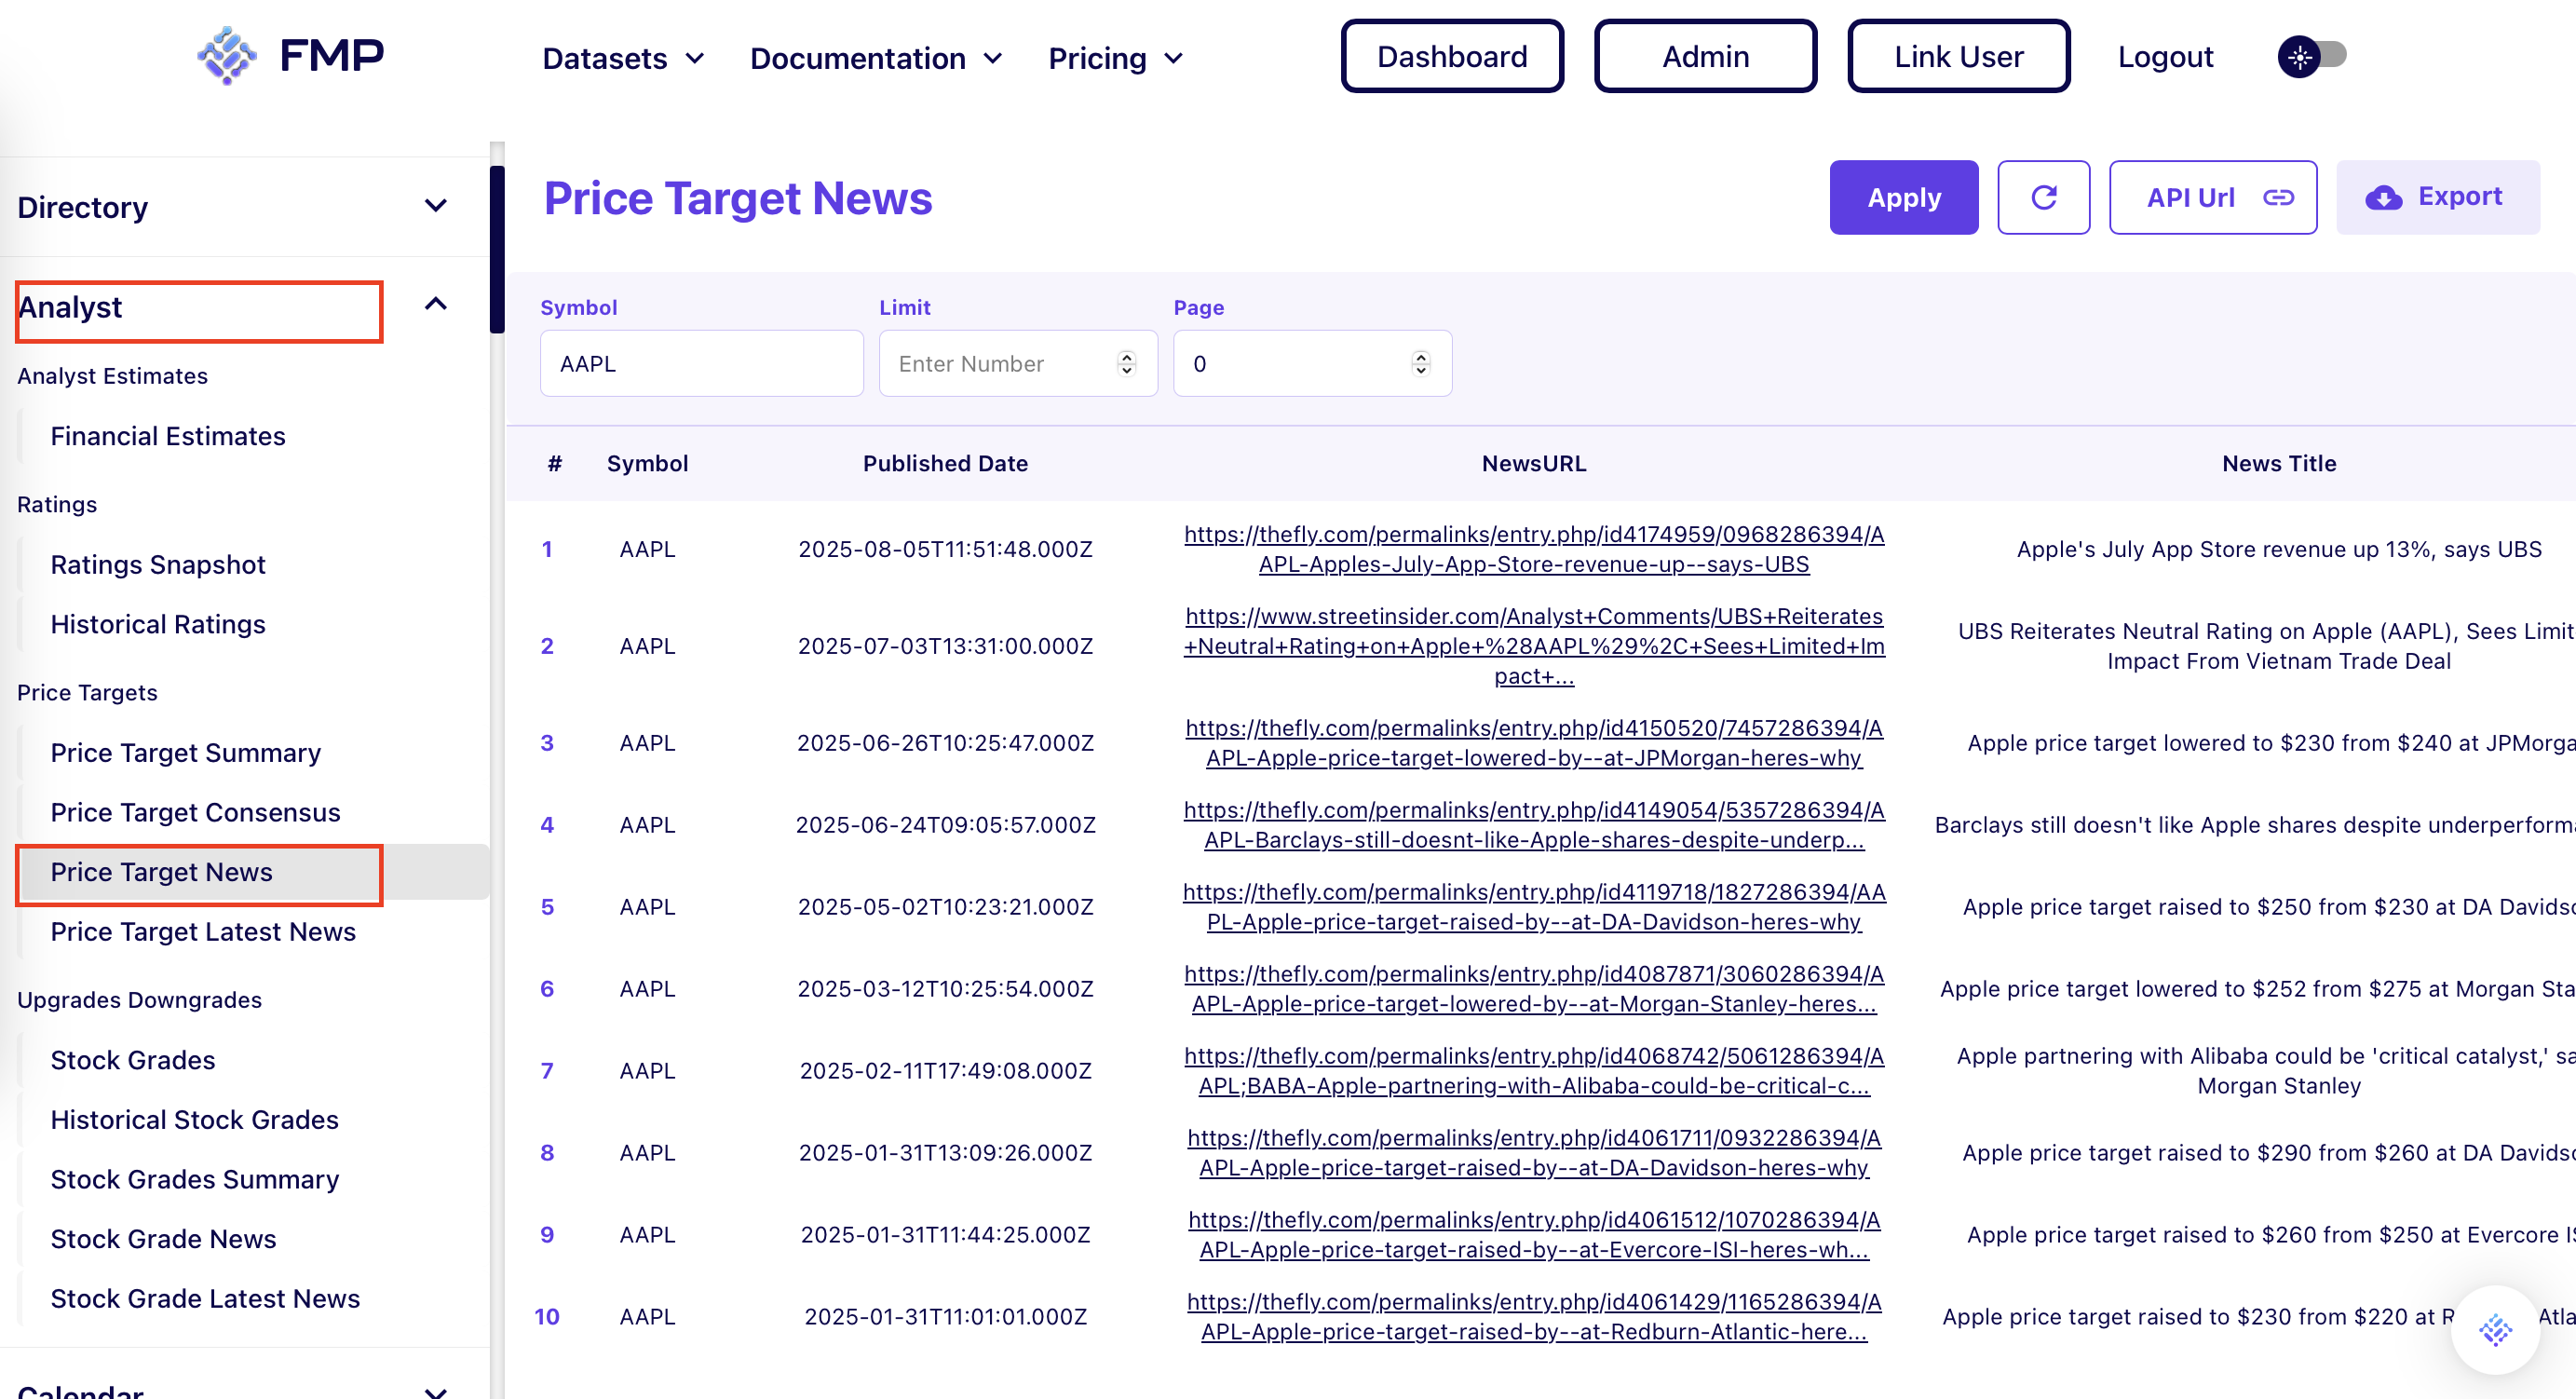
The FMP API Viewer also aggregates stock target prices data that executives and investors care about. For example, under the Analyst tab, you can find the Price Target endpoint, which lists analysts' target prices for the stock and any recent changes. Select that, and the Viewer will show a table of recent analyst target updates, including the analyst's name, their firm, the new target price, and possibly links to news or reports. This is incredibly useful to gauge how bullish or bearish the analyst community is on the stock. If you see multiple targets raised recently, it's a positive signal; cutting targets might warrant caution.
Market & Sector Data
The Viewer isn't limited to individual stocks. Under categories like Market Performance or Indexes, you might pull broader metrics - for example, get the S&P 500 index historical data, or check a list of top gainers and losers for today's market. This helps put a stock's performance in context. If your stock is down 2% but the whole market is down 3%, you know it's actually outperforming the market. FMP provides sector performance and other macro datasets too, which you can access similarly through the no-code interface.
Slash Stock Analysis Time with FMP API Viewer
Using the API Viewer for stock performance analysis means you can do in minutes what used to take hours of browsing charts or writing code. Want to see if a stock is trading near its 52-week high or low? Just grab the historical prices and you'll have the answer.
Curious about how volatile it's been? Export the price history and quickly calculate metrics in Excel. The visual interface of the Playground even allows you to scan data for trends before downloading it - a big time-saver for quick insights. For example, you can spot a general upward trend in the data table, then decide to export it for plotting.
In short, whether you're doing short-term trading analysis or long-term performance review, the FMP API Viewer gives you a fast, efficient way to get the numbers behind the stock's story.
Empower Your Analysis with a No-Code Playground
The FMP API Viewer brings the power of professional-grade financial data to your fingertips in a confident, clear, and efficient way. By combining vast datasets with an active, tech-savvy interface, it enables everyone from retail investors to CFOs to analyze companies with ease.
We've seen how you can pull detailed financial statements, compute financial ratios, and review stock performance metrics all in one session - without writing code or manually aggregating data from multiple sources. This not only saves time but also improves the quality of your decisions, since you're leveraging comprehensive and up-to-date information.
In practice, the API Viewer can fundamentally streamline your workflow. You might start by quickly checking a stock's recent price swings and news, then dive into its balance sheet strength, and finally export a few key metrics to compare against peers, all in a matter of minutes. That kind of agility is exactly the pain point this tool addresses; it turns what used to be a tedious process into a smooth, interactive experience.
Next Steps, head over to the FMP Playground and test it out with a company you're interested in. Sign up for a free account (if you haven't), plug in a ticker symbol, and explore a dataset that intrigues you, be it a financial statement, a stock chart, or an earnings calendar. With FMP's rich data and no-code interface, you'll quickly see how it can become an indispensable part of your investment research toolkit.
FAQs
What is the FMP API Viewer, and how is it related to the FMP Playground?
The FMP API Viewer is an interactive, web-based tool provided by Financial Modeling Prep that lets you explore their financial data without coding. It is essentially the same as the FMP “Playground” - a no-code API interface where you can select companies and data endpoints to instantly retrieve information. In the Playground/API Viewer, you'll find a sidebar of datasets (financial statements, stock prices, etc.) and a main area where data results are displayed. It's a way to use FMP's APIs through a graphical interface.
Do I need programming skills or an API key to use the FMP API Viewer?
No programming skills are required - the Viewer is designed for non-technical users and professionals who want data without writing code. The interface handles API calls behind the scenes. You will need to sign up for a free FMP account (which provides an API key) to use the Playground, since the data comes from FMP's API. Signing up is straightforward and free for personal use, and it ensures you stay within free daily request limits. Once logged in, the Playground uses your API key automatically. After that, using the tool is as simple as point-and-click. Every endpoint can be accessed with just a few clicks, so even if you have zero coding experience, you can retrieve complex financial data easily.
What types of data can I access with the FMP API Viewer?
The FMP API Viewer gives you access to a wide range of financial and market data. This includes:
Financial Statements - Income statements, balance sheets, cash flow statements (quarterly and annual) for thousands of companies.
Financial Ratios & Metrics - Pre-calculated ratios (P/E, ROE, profit margins, etc.) and key metrics like growth rates and financial health scores.
Stock Market Data - Real-time stock quotes, historical price data (intraday and end-of-day), volume, and technical indicators (EMA, RSI, etc.).
Analyst Data - Analyst price targets, rating upgrades/downgrades, earnings estimates and surprises.
Company Profile - Company descriptions, industry, CEO, market capitalization, and other profile info.
Market News and Economic Data - Financial news headlines, press releases, and macro-economic indicators (like interest rates, GDP).
Forex, Crypto, Commodities - Data for currency exchange rates, cryptocurrency prices, commodity prices.
In essence, almost everything FMP's API offers is accessible through the Viewer. You can browse the sidebar or use the search bar in the Playground to find the specific dataset you need.
Can I export or download data from the FMP Playground?
The API Viewer is built to let you export data easily for your own use. Once you've retrieved a dataset on the screen, you can click the Export button at the top right of the Playground. This gives you options to download in CSV, JSON, or text format.
Other Blogs

Walk Me Through a DCF: A Simple Guide to Discounted Cash Flow Valuation
Are you curious about how professional investors decide whether a stock might be one of the best undervalued stocks to b...

Technical Analysis 101: Understanding Support and Resistance
Technical analysis is a fundamental approach used by traders to forecast price movements based on historical market data...

How an Economic Moat Provides a Competitive Advantage
Introduction In the competitive landscape of modern business, companies that consistently outperform their peers ofte...