FMP
Analyze companies quickly. The most important indicators for equity investors.
Aug 04, 2024
There are many valuable indicators for investors to find great stocks. You may have heard analysts using P/E and P/S ratios a lot to see how much people are willing to pay for a company's earnings and revenue. But a lot of ratios do not reflect a good picture, especially now when there is high speculative capital in the market. Prices are skyrocketing, driven by high trader expectations, while companies are showing reports in line with analyst expectations. Using the P/E ratio and other price multipliers can be very misleading for investors. Today, I want to talk about other useful financial indicators that can benefit investors as they allow for evaluating a company quickly, sorting equities, and finding great stocks. In the first part of the article, I will tell you what those indicators are and how to calculate them. Then I will explain how you can use Financial Modeling Prep data points to extract company data to calculate those indicators. And you will have a great layout for finding great shares quickly.
Valuable indicators for investors. A Deep Dive
The indicators I am talking about are ROIC and WACC. ROIC stands for return on invested capital. In simple terms, it shows what a company earns on its invested capital (equity and debt). A company attracts debt and issues equity to finance its operations, and ROIC examines the company's return for attracting funding through debt and equity. WACC, on the other hand, stands for the weighted average cost of capital. It shows what cost the company is bearing on its equity and debt. It takes the company's debt, calculates the cost of attracting the debt, then calculates the cost of its equity, and then adds them together, taking into account the debt and equity weight. These are very useful indicators that can show how efficient the company is. For example, if ROIC exceeds WACC, it means that the company is earning more on its invested capital, but if WACC is more than ROIC, it means that the company is bearing more costs on its attracted capital. Now, let's see how investors can use those indicators. First, they calculate ROIC and WACC for their selected company, see the difference, and then do the same calculations for the company's closest peers. They then choose the company that has the highest ROIC-WACC difference, where ROIC should exceed WACC. Now, let's see how investors can calculate ROIC and WACC and use Financial Modeling Prep data points to extract the data.
Calculating ROIC and WACC
In this part, I will show you how to extract data if you don't have developer skills. You will need Google Sheets. First, you need to install the Google Sheets add-on using the instructions. After you have installed the add-on, you can start making your calculations. In the opened Google Sheet, go to any empty cell and place the following formula: =fmpKeyMetricsTtm("AAPL"). You can choose any stock, but in this example, we are considering AAPL stock, that's the ticker that we put into the formula. If you installed the FMP add-on correctly, you will see Financial Modeling Prep Key Metrics data.
Then go to an empty cell and input the following formula: =fmpProfile("AAPL") to get Apple's main data. You will see the data populate after you press the Enter key on your keyboard.
Next, input this formula and hit Enter: =fmpIncomeStatement("AAPL") to get Apple's income statement that was extracted using Financial Modeling Prep company income statement API.
After that, extract the company's balance sheet by using Financial Modeling Prep Balance Sheet API, use this formula : =fmpBalanceSheetStatement("AAPL").
Then you will need treasury rates and this formula: =fmpTreasuryRates(). Place it in an empty cell
The last formula is for financial ratios: =fmpRatios("AAPL"). Also should be placed in an empty cell.
After extracting the data, you will have something like this. I removed unnecessary cells and left only recent data to make everything readable.
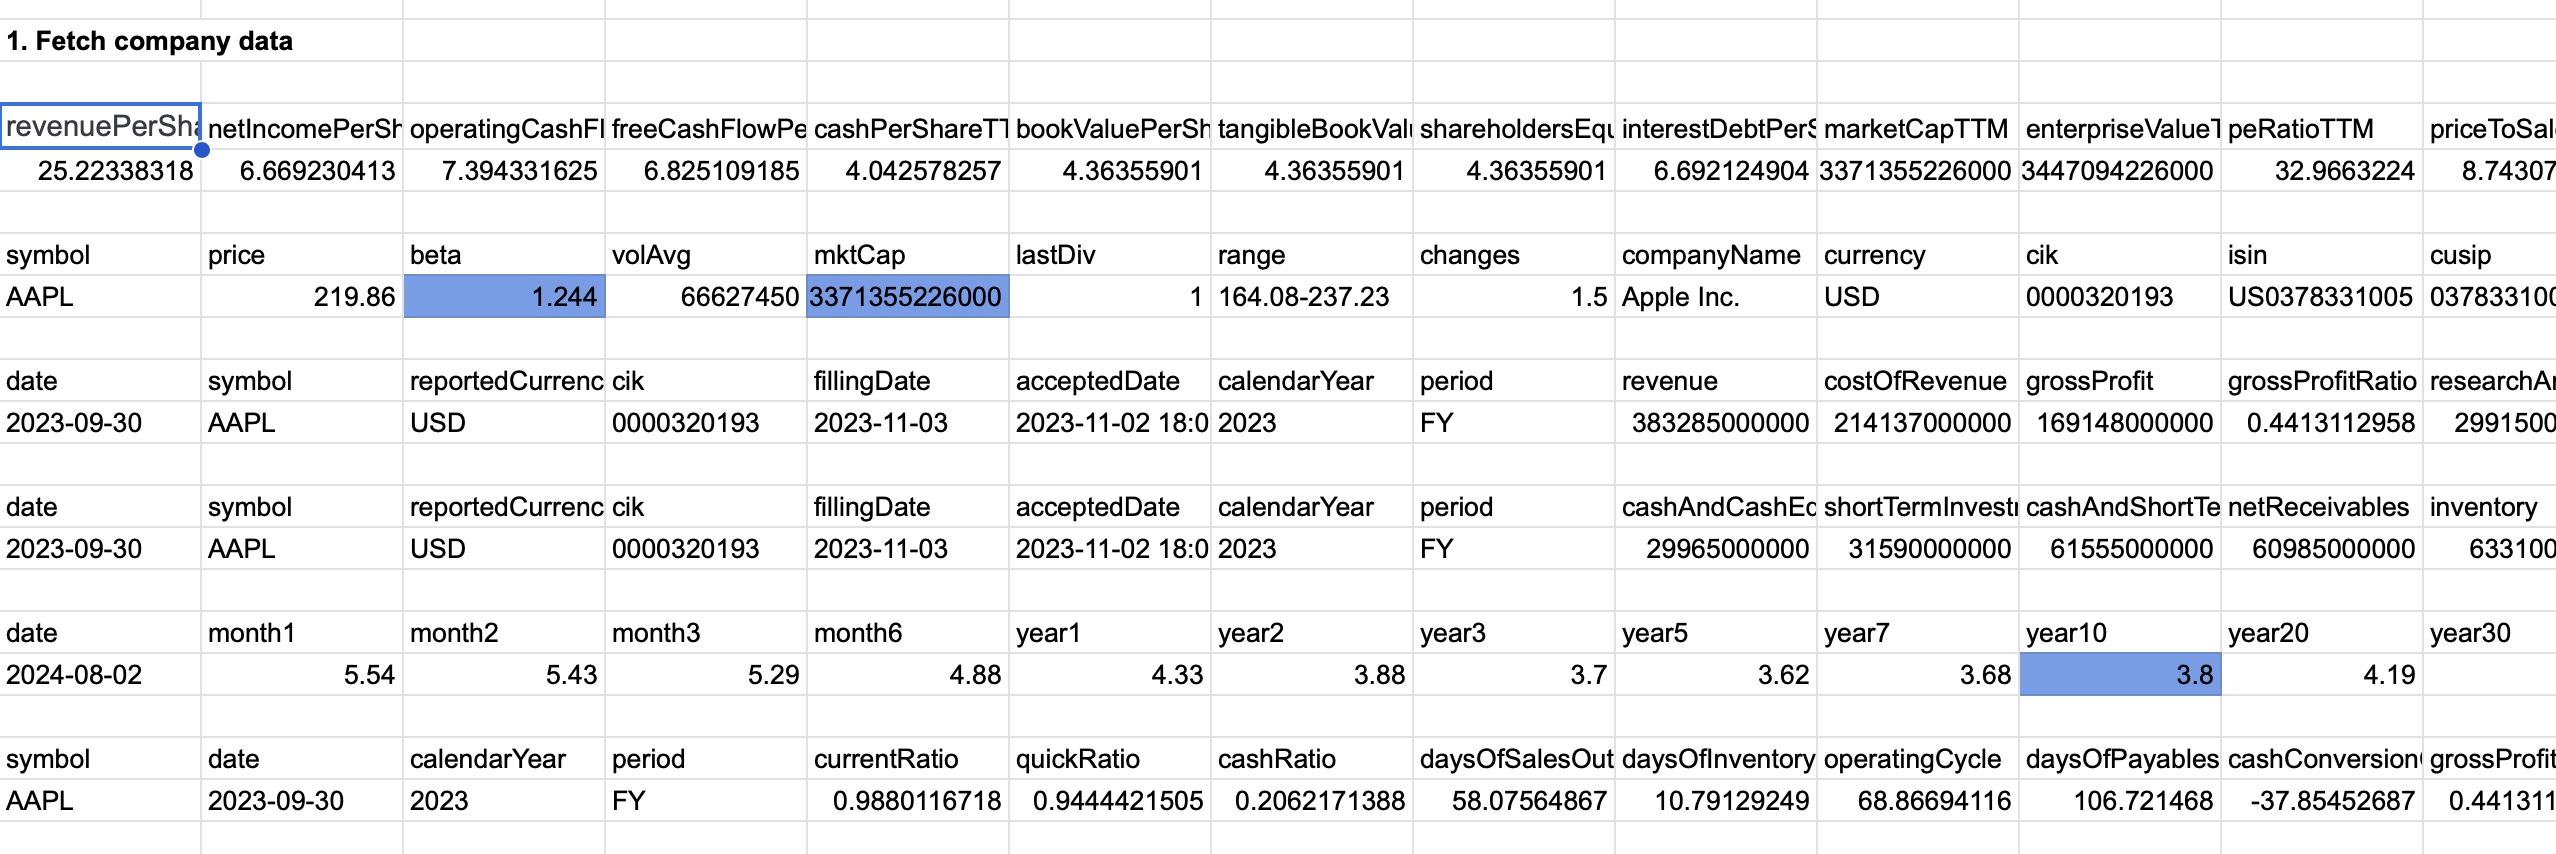
After fetching all the data, it is time to make our calculations. You don't have to calculate ROIC because it is already given. If you see the data that you extracted using the formula =fmpKeyMetricsTtm, you need to find roicTTM in the table. Congratulations, you already have the first ingredient. Now it's time to calculate WACC. It is more time-consuming, but don't worry, you already have all the data. WACC is calculated using the formula:
WACC = E/V × Re + D/V × Rd × (1 − Tc)
where E is the market value of equity, D is the market value of debt, V is debt + equity, Re is the cost of equity, Rd is the cost of debt, and finally Tc is the tax rate.
First, let's calculate the cost of equity. It is calculated using the formula:
Re = Rf + β × (Rm − Rf)
where Rf is the risk-free rate. Investment analysts usually take the 10Y treasury yield, which was already extracted using the formula =fmpTreasuryRates(); just take the year10 number from the extracted field. β is the stock Beta, which can be found in the data we extracted using =fmpProfile("AAPL"). You can copy the Beta number from the fetched table. Rm is the market average return. I took the inflation-adjusted average return for the longer-term period, which is equal to 7%. You should not change this number regularly since this is the average data. Rf is the risk-free rate that we already extracted. Based on the above calculation, our cost of equity is 0.07780 or 7.78%. You can see the formula in the highlighted cell below.
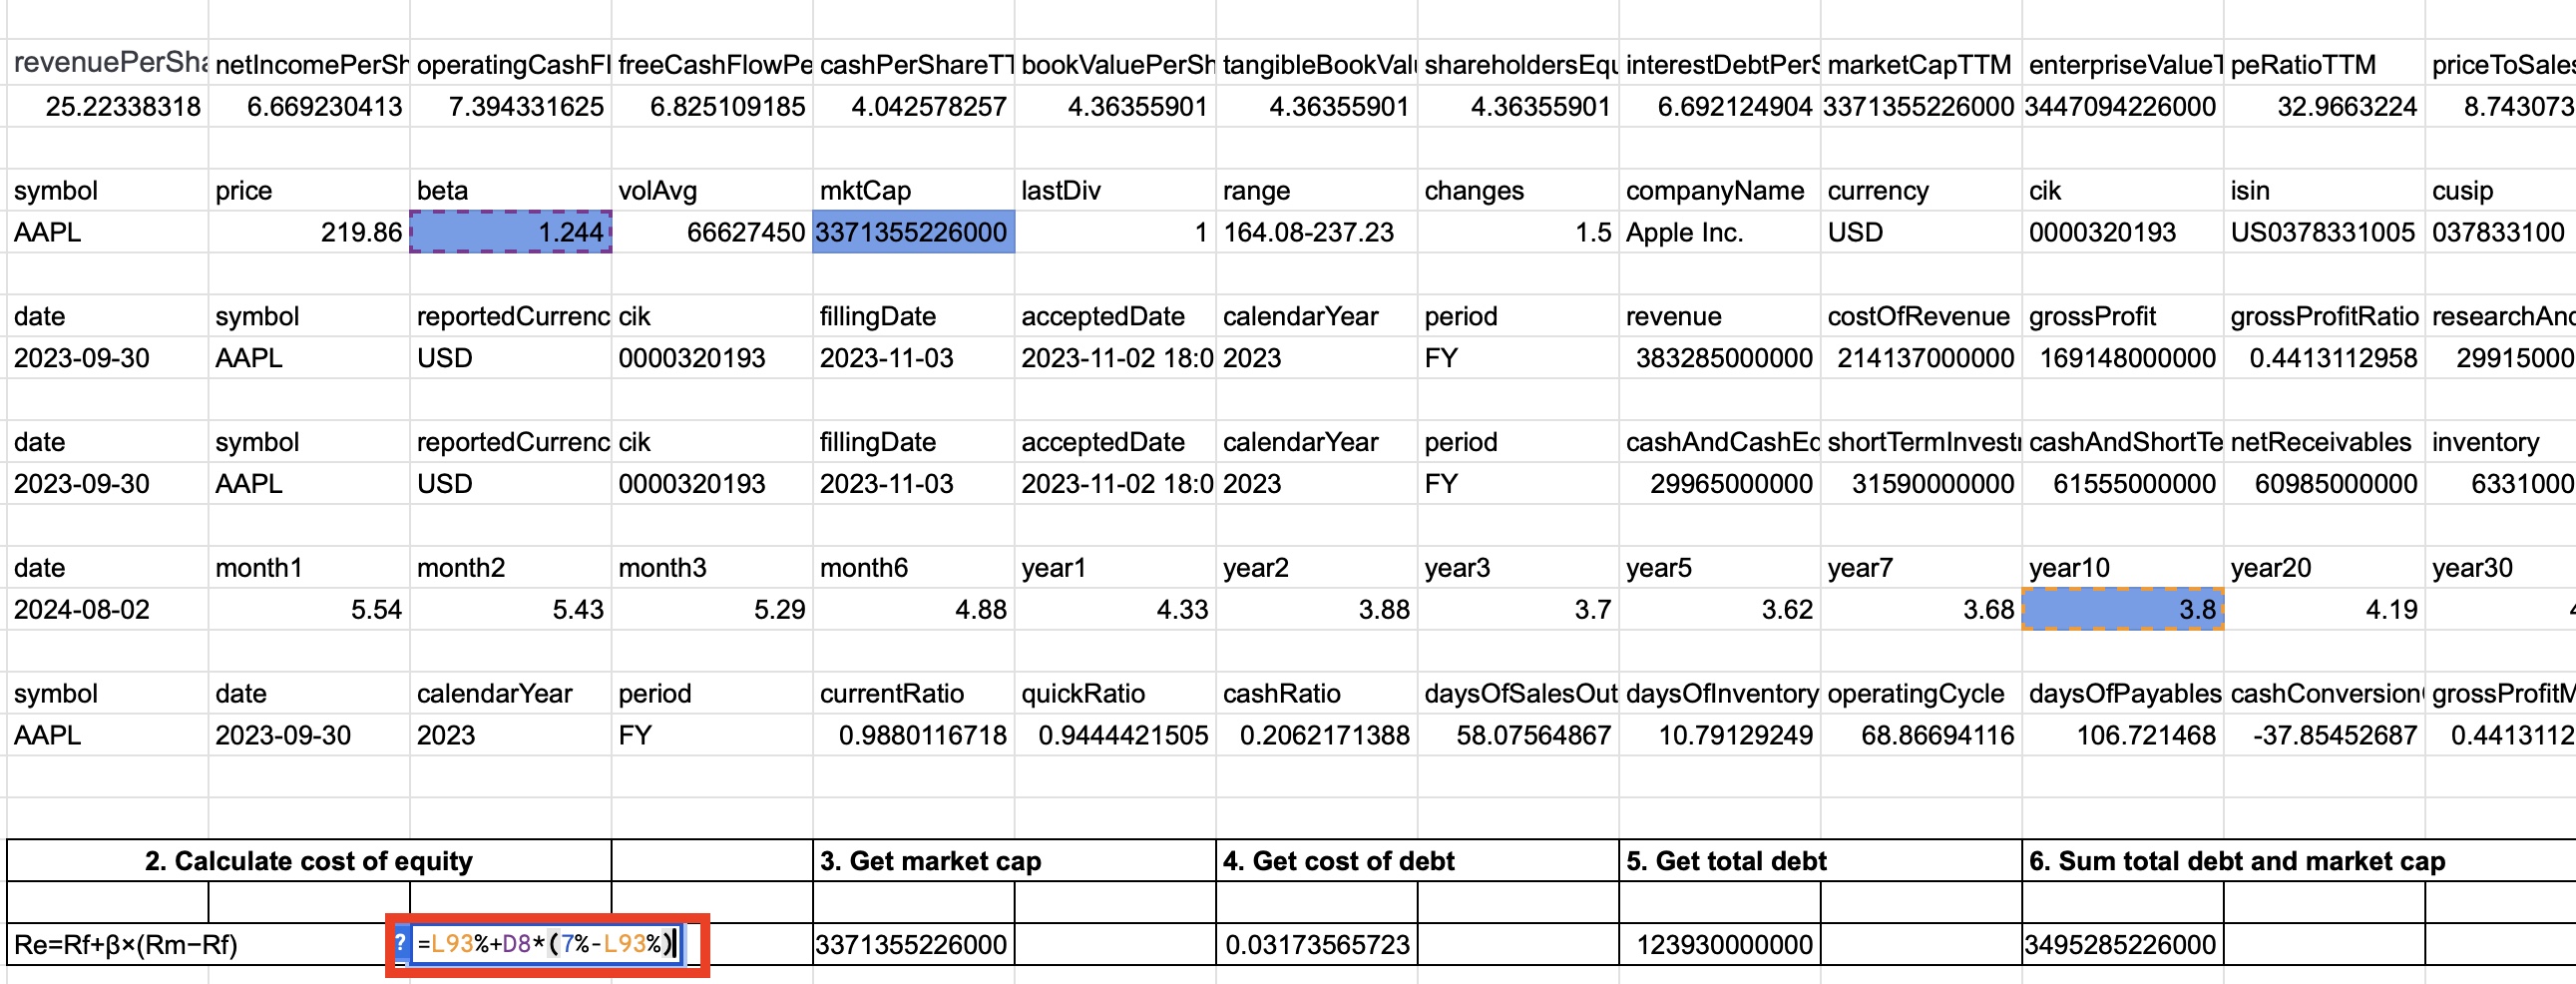
The next step is to get the market cap, which can be copied from the same data as Beta, the field is called mktCap, which is 3 trillion in our example.
The next step is to calculate the cost of debt. It is calculated by dividing interest expense by total debt. Interest expense can be found in the income statement that we fetched, and total debt is in the balance sheet. Based on our calculations, the cost of debt for our stock is 0.03 or 3%.
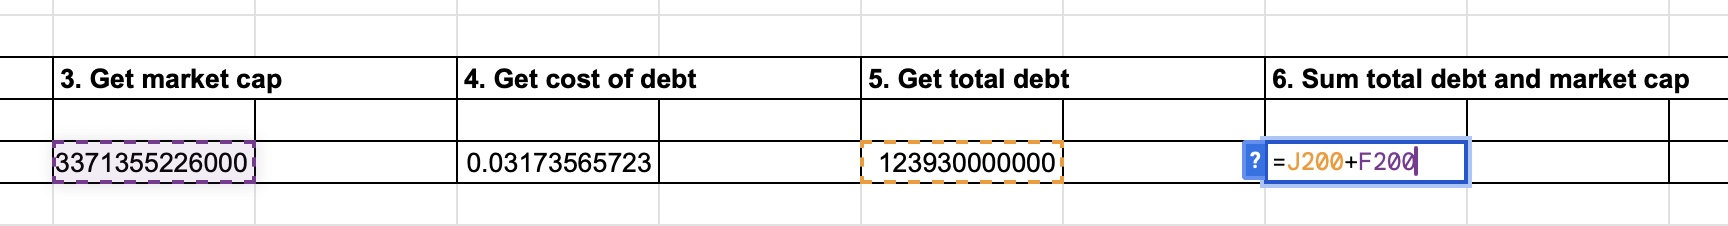
The next step is to sum up the total debt and market cap. You can see the calculated result below.
The final step is to calculate WACC using the formula mentioned above. You can see the print-screen below to get an idea of how I made this calculation. The WACC in our example is equal to 0.076 or 7%.
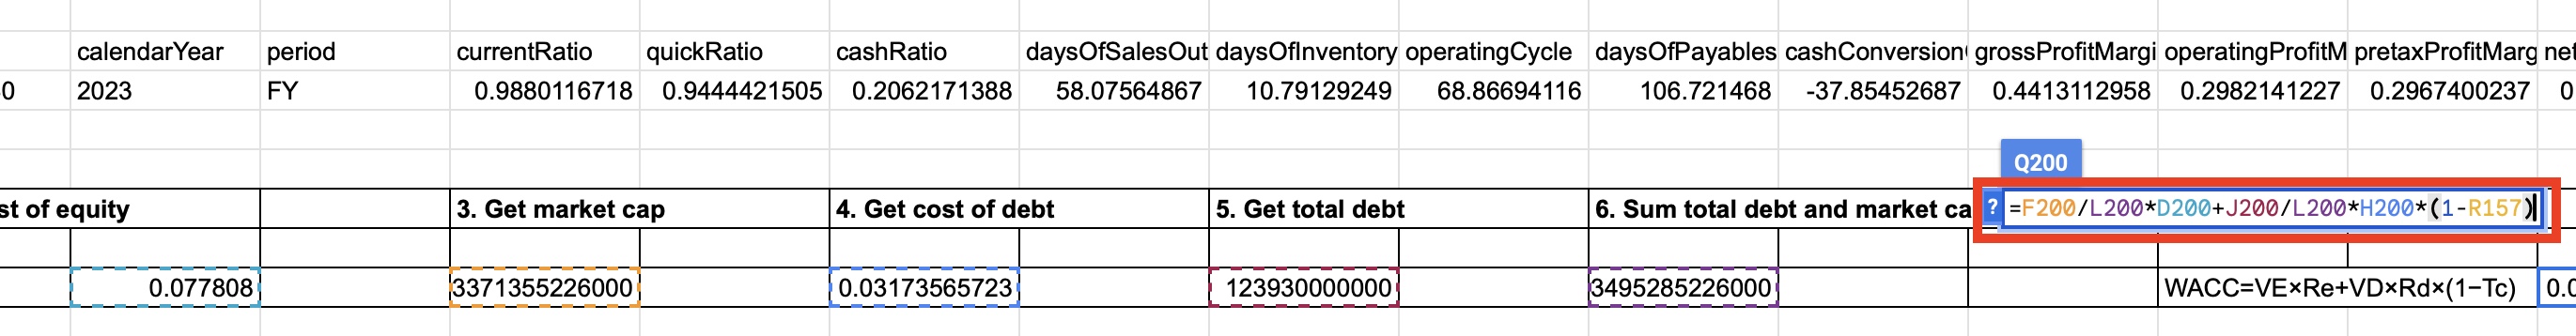
The last step is to compare ROIC with WACC. Remember that ROIC should exceed the WACC, and in our example, this is the case where ROIC is equal to 0.60 or 60% and WACC is 0.076 or 7%, which is a great number and tells us that Apple is using money proceeds from its attracted funds efficiently. Now you can do the same calculations for the closest peers to check if there are companies that use their funds even better. And by the way, now you don't have to do these long calculations again since you already have a great template. Thank you for reading the article.

How an Economic Moat Provides a Competitive Advantage
Introduction In the competitive landscape of modern business, companies that consistently outperform their peers ofte...

Apple’s Slow Shift from China to India: Challenges and Geopolitical Risks
Introduction Apple (NASDAQ: AAPL) has been working to diversify its supply chain, reducing dependence on China due to...

MicroStrategy Incorporated (NASDAQ:MSTR) Earnings Preview and Bitcoin Investment Strategy
MicroStrategy Incorporated (NASDAQ:MSTR) is a prominent business intelligence company known for its software solutions a...