FMP
Real-Time Stock Market Data APIs: Exploring FMPs Complete API Suite for Live Financial Data
Oct 27, 2025
Financial Modeling Prep (FMP) provides a unified API ecosystem for real-time and reference market data. Its suite of endpoints spans stock symbols, live quotes, financial statements, calendars, transcripts, and more—covering the full cycle of market insight from identification to analysis. Each endpoint delivers structured JSON data for seamless integration into trading platforms, dashboards, and analytics systems. Together, these APIs form a cohesive toolkit that allows traders and analysts to uncover, track, and interpret market trends with precision and speed.
Below is an overview of key FMP endpoints, including their functionality, parameters, and how traders or analysts can use them to improve their investment decisions.
FMP Real-Time API Suite Overview
Financial Modeling Prep's APIs operate as a unified ecosystem for real-time, fundamental, and calendar data. Use the table below to explore each endpoint and understand how it fits into your market data workflow.
FMP Real-Time and Reference Data Endpoints
|
Endpoint Name |
Best Use Case |
|
Stock Symbol Search API |
Look up company tickers and symbol variations across global exchanges to build accurate watchlists or validate inputs for other API calls. |
|
Financial Statement Symbols List API |
Discover all companies with available financial statements before automating balance sheet or income statement queries. |
|
CIK List API |
Match companies to their SEC Central Index Keys (CIKs) for filing lookups, regulatory research, and cross-system normalization. |
|
Symbol Changes List API |
Track ticker and company name changes to keep datasets, dashboards, and trading systems current. |
|
Actively Trading List API |
Scan the market for all currently active securities to focus analysis on tradable assets only. |
|
Stock Quote API |
Retrieve live price and volume data to power real-time dashboards, trading bots, or portfolio trackers. |
|
1-Minute Interval Stock Chart API |
Analyze intraday movements with minute-level OHLCV data to fine-tune entry and exit strategies. |
|
Exponential Moving Average (EMA) API |
Detect short-term trend shifts or generate buy/sell signals based on dynamic price averages. |
|
Dividends Calendar API |
Plan for upcoming dividend events and forecast income streams in yield-focused strategies. |
|
Earnings Report API |
Track upcoming and past earnings announcements to model post-earnings reactions or update forecasts. |
|
IPOs Calendar API |
Monitor newly listed and upcoming IPOs to identify early-stage investment opportunities. |
|
Earnings Transcript API |
Analyze quarterly call transcripts for tone, sentiment, and recurring management themes. |
|
Institutional Ownership Filings API |
Monitor shifts in institutional holdings to spot accumulation, distribution, or fund strategy changes. |
|
FMP Articles API |
Integrate FMP's latest research and news into your analytics tools or market sentiment dashboards. |
|
Financial Statements APIs (Income, Balance Sheet, Cash Flow) |
Conduct deep fundamental analysis, valuation modeling, and long-term trend comparison using structured financial data. |
The APIs below form the foundation of FMP's real-time data suite — enabling traders, developers, and analysts to access and automate global market intelligence. Together, these endpoints give you a complete workflow—from identifying and tracking securities in real time to analyzing performance drivers and institutional behavior.
Stock Symbol Search API
The Stock Symbol Search API lets users look up the ticker symbol and basic details of a company by name or symbol query. It searches across multiple exchanges to find matching securities.
For example, querying AAPL returns Apple Inc. 's symbol and variants (e.g. “AAPL.NE”, “AAPL.MX”) along with currency and exchange details. This API is useful when you know a company name (or partial name) but not the exact ticker
Endpoint:
|
https://financialmodelingprep.com/stable/search-symbol?query={QUERY}&apikey=YOUR_API_KEY |
Parameters:
- query (string, required) - the company name or symbol fragment to search for.
Example Response Fields:
- Each result includes symbol, name, currency, exchangeFullName, exchange (see data above).
Usage:
- Traders and analysts can use this endpoint to resolve company names to tickers, discover multiple listings for the same company, or verify symbols.
For instance, a user searching “Apple” would retrieve all relevant Apple Inc. tickers, aiding in building watchlists or ensuring correct symbols in further API calls.
Financial Statement Symbols List API
The Financial Statement Symbols List API provides a list of all companies for which financial statements are available via FMP. It returns a comprehensive catalog of ticker symbols along with basic company identifiers.
For example, it can list symbols like “TRV” (The Travelers Companies, Inc.) and “6231.T” (a Tokyo-listed company) along with their trading and reporting currencies. This helps users discover which companies' income statements, balance sheets, and cash flows can be queried.
Endpoint:
|
https://financialmodelingprep.com/stable/financial-statement-symbol-list?apikey=YOUR_API_KEY |
Example Response Fields:
- Objects with symbol, companyName, tradingCurrency, reportingCurrency (as in the JSON snippet above).
Usage:
- An analyst might first call this API to get a list of all available symbols, then iterate over the list to fetch financial statements for each. It ensures that API clients only request data for symbols known to have filings.
For example, one could filter this list for companies in a particular country or exchange to bulk-download their financial statements for industry analysis.
CIK List API
The CIK List API returns a database of SEC Central Index Key (CIK) numbers and company names for registered entities. Each CIK is a unique identifier used in SEC filings (e.g. 0002083677 corresponds to Tribridge Partners Financial LLC in the example above). This API is essential for regulatory compliance and SEC-related research.
Endpoint:
|
https://financialmodelingprep.com/stable/cik-list?page={PAGE}&limit={LIMIT}&apikey=YOUR_API_KEY |
Parameters:
- page (integer) - pagination index (default 0).
- limit (integer) - number of records to return per page (e.g. 1000).
Example Response Fields:
- Entries include cik and companyName (see sample above).
Usage:
- Portfolio managers and compliance officers can use the CIK API to map stock tickers to CIKs before pulling SEC filings like 10-Ks or 13Fs.
For example, an analyst might find the CIK for an institutional investment company to then query its 13F holdings. The CIK list also helps ensure data normalization (using the same unique identifiers across systems).
Symbol Changes List API
The Symbol Changes List API tracks recent ticker symbol changes across markets. It returns records of name changes, mergers, or ticker reassignments. Each record includes the date, company name, old symbol, and new symbol (e.g. on 2025-10-20 “SOLAI Limited” changed from “BTCM” to “SLAI”).
Endpoint:
|
https://financialmodelingprep.com/stable/symbol-change?apikey=YOUR_API_KEY |
Example Response Fields:
- Objects with date, companyName, oldSymbol, newSymbol.
Usage:
- Traders use this endpoint to keep their symbol databases up to date. For example, if a company rebrands and changes its ticker, this API flags that change so automated systems can replace old tickers.
- Analysts could also scan this list to identify corporate actions (e.g. mergers causing ticker changes) and adjust historical data accordingly.
Actively Trading List API
The Actively Trading List API lists all symbols that are currently active in the market. It returns symbols and company names for securities with ongoing trading activity (e.g. “TRV”, “VOX.WA”, “GENW”).
Endpoint:
|
https://financialmodelingprep.com/stable/actively-trading-list?apikey=YOUR_API_KEY |
Example Response Fields:
- Each entry includes symbol and name.
Usage:
- This endpoint is useful for scanning the current market and populating trading screens. For instance, a real-time monitoring system could fetch this list to display all active stocks for further filtering (by sector, price movement, etc.).
It ensures that strategies or dashboards focus on securities currently tradable, ignoring delisted or inactive symbols.
Stock Quote API
The Stock Quote API delivers real-time quote data for specific securities. It provides up-to-the-minute pricing information, including price, change, change percentage, volume, and trading range (day low/high, 52-week low/high, etc.) for a given ticker.
For example, querying Apple's quote returns fields like price=263.39, change=1.15, and volume=35414028.
Endpoint:
|
https://financialmodelingprep.com/stable/quote?symbol={SYMBOL}&apikey=YOUR_API_KEY |
Parameters:
- symbol (string) - the stock ticker (can often supply comma-separated list for multiple symbols).
Example Response Fields:
- Includes symbol, name, price, change, changePercentage, volume, dayLow, dayHigh, yearLow, yearHigh, marketCap, open, previousClose, exchange, timestamp, etc.
Usage:
- Traders use the Quote API to get live price data for watchlists or to trigger alerts. Analysts might pull quotes periodically to calculate indicators (e.g. moving averages or price charts).
For example, an application could call this endpoint for each portfolio stock to display current P/L or update charts in real time.
1-Minute Interval Stock Chart API
The 1-Minute Interval Stock Chart API provides detailed intraday price and volume data at one-minute granularity. It returns a time series of open/high/low/close prices and volume for each minute. This API is ideal for day traders and algorithmic strategies that require high-frequency data.
Endpoint:
|
https://financialmodelingprep.com/stable/historical-chart/1min?symbol={SYMBOL}&apikey=YOUR_API_KEY |
Parameters:
- symbol (string) - the stock ticker.
Example Response Fields:
- Each record includes date (timestamp), open, low, high, close, and volume)
Usage:
- Traders can use this for intraday charting and analysis.
For example, a scalper might fetch today's one-minute bars to identify short-term trends or support/resistance levels. The API's minute-by-minute data enables calculation of real-time indicators (like intraday RSI) or backtesting of minute-level trading strategies.
Exponential Moving Average (EMA) API
The Exponential Moving Average (EMA) API is one of FMP's technical indicator endpoints. EMA is a common trend-following indicator that places more weight on recent prices to smooth out market noise.
In practice, a rising EMA indicates an uptrend while a falling EMA signals a downtrend. EMAs react faster to price changes than simple moving averages, making them valuable for spotting short-term trend shifts and potential support or resistance levels.
Endpoint:
|
https://financialmodelingprep.com/stable/technical-indicators/ema?symbol=AAPL&periodLength=10&timeframe=1day&apikey=YOUR_API_KEY |
Parameters:
- Symbol - Stock ticker symbol (e.g. AAPL).
- periodLength - Length of the EMA period (number of intervals).
- Timeframe - Data interval (e.g. 1day, 1min, etc.).
Usage:
- Detecting the strength and direction of short-term price trends (e.g. crossing of price and EMA).
- Generating trading signals or strategies based on trend changes (e.g. buy when price crosses above EMA)
Dividends Calendar API
The Dividends Calendar API returns scheduled dividend events for stocks, including record and payment dates, dividend amounts, and yields. It provides a market-wide view of upcoming dividends. For example, it might list that stock “PPTY” has a dividend of 0.30 with a yield of 4.735% on 2025-10-21.
Endpoint:
|
https://financialmodelingprep.com/stable/dividends-calendar?apikey=YOUR_API_KEY |
Example Response Fields:
- Each entry includes symbol, date (ex-dividend date), recordDate, paymentDate, declarationDate, adjDividend, dividend, yield, frequency.
Usage:
- Income-focused investors and analysts use this to track dividend payouts.
For instance, a dividend portfolio manager can query this API to find stocks that will pay dividends within the next week and check their yields. It also helps in financial forecasting (knowing when cash flows from dividends will arrive) and in calendarizing expected income.
Earnings Report API
The Earnings Report API provides upcoming and past earnings announcement data for a given ticker. It returns the date of each earnings report along with actual or estimated EPS and revenue figures. For example, it shows Apple's Q3 2025 report (date, estimated EPS/revenue, last update) and previous actuals.
Endpoint:
|
https://financialmodelingprep.com/stable/earnings?symbol={SYMBOL}&apikey=YOUR_API_KEY |
Parameters:
- symbol (string) - the stock ticker to query.
Example Response Fields:
- Includes symbol, date (report date), epsActual, epsEstimated, revenueActual, revenueEstimated, lastUpdated.
Usage:
- Traders use this to prepare for earnings season. Knowing the dates of upcoming reports and consensus estimates allows investors to model post-earnings moves or hedge risk.
- Analysts can fetch this to compare actual results versus estimates once available.
For example, you might pull this API before Apple's earnings to see the estimated EPS and later after the report to see the actual EPS and revenue figures.
IPOs Calendar API
The IPOs Calendar API lists all forthcoming initial public offerings (IPOs). It gives details such as the IPO date, company name, expected price range, and exchange. This helps investors follow new market entrants.
Endpoint:
|
https://financialmodelingprep.com/stable/ipos-calendar?apikey=YOUR_API_KEY |
Example Response Fields:
- Typically includes fields like symbol (if assigned), company, date (expected IPO date), exchange, shares and priceRange if available.
Usage:
- Venture investors and general market participants use this to spot new investment opportunities.
For example, a fund focusing on IPOs might poll this API daily to update their list of companies about to go public and prepare due diligence. Similarly, an analyst could use it to analyze IPO market activity or the calendar of new listings.
Earnings Transcript API
The Earnings Call Transcript API returns the full text of a company's quarterly earnings call. Users specify a ticker symbol, fiscal year, and quarter; the API returns the transcript content in JSON format. For example, fetching symbol=AAPL, year=2025, quarter=2 would retrieve Apple's Q2 2025 call transcript. This includes everything from the operator's opening to CEO and CFO remarks and the analyst Q&A.
Endpoint:
|
https://financialmodelingprep.com/stable/earning-call-transcript?symbol={SYMBOL}&year={YEAR}&quarter={QUARTER}&apikey=YOUR_API_KEY |
Parameters:
- symbol (string) - stock ticker.
- year (int) - earnings year (e.g. 2025).
- quarter (int) - fiscal quarter (1-4).
Example Response Fields:
- The JSON array contains objects with symbol, date, period, year, and content (the full transcript text).
Usage:
- Analysts and quantitative researchers use this to analyze management's commentary.
For instance, sentiment analysis algorithms can process the content field to gauge tone or search for keywords (like “guidance” or “inflation”). This API automates what used to be a manual process of reading transcripts, letting users quickly parse company remarks across quarters. It provides a full-text transcripts from the operator's introduction to the Q&A session and even historical calls via the year and quarter parameters.
Institutional Ownership Filings API
The Institutional Ownership Filings API provides up-to-date data on SEC filings by institutional investors. In particular, it returns recent Form 13F and other filings that disclose the holdings of large funds and institutions.
This API is useful for tracking which firms hold shares in various companies and for detecting big changes in institutional positions.
Endpoint:
|
https://financialmodelingprep.com/stable/institutional-ownership/latest?page=0&limit=100&apikey=YOUR_API_KEY |
Parameters:
- Page - Page number for pagination (default 0)
- Limit - Number of results per page (default 100)
Usage:
- Tracking institutional holdings and the largest investors in each company.
- Monitoring when major funds or hedge funds buy or sell shares (via their SEC filings).
- Informing investment research, trend analysis or compliance by keeping tabs on institutional ownership and regulatory filings.
FMP Articles API
The FMP Articles API returns the latest market news articles and research posts published by FinancialModelingPrep. Each article entry includes the title, publication date, content summary (or HTML snippet), related tickers, image link, and a direct URL to the article. For example, recent entries might be a note on General Motors or a report on Balchem Corporation.
Endpoint:
|
https://financialmodelingprep.com/stable/fmp-articles?page={PAGE}&limit={LIMIT}&apikey=YOUR_API_KEY |
Parameters:
- page (integer) - page number for pagination.
- limit (integer) - number of articles to return per page.
Example Response Fields:
- Objects with title, date, content, tickers (e.g. "NYSE:GM"), image (URL), link, author, site.
Usage:
- This API helps investors stay informed of FMP's news and analysis. A trader might fetch these articles to integrate news sentiment or to display recent market commentary in a dashboard.
For example, an advisor could monitor FMP's posts on a stock to catch any important ratings change or market insight. Note that this endpoint provides FMP's own content (as opposed to general news feeds).
Financial Statements API
FMP also provides Financial Statements APIs (such as Income Statement, Balance Sheet, Cash Flow) to retrieve detailed fundamental data for companies. For instance, the Income Statement API returns line items like revenue, operating expenses, and net income for each reporting period. These endpoints typically take a symbol and return the company's financial statements over time.
Endpoint:
|
https://financialmodelingprep.com/stable/income-statement?symbol={SYMBOL}&apikey=YOUR_API_KEY (similarly for balance-sheet and cash-flow). |
Parameters:
- symbol (string) - the stock ticker.
- (Optional: period for annual vs quarterly, limit for number of years, etc.)
Usage:
- Analysts use these endpoints for fundamental analysis.
For example, one could fetch Apple's income statements to compute growth rates or profit margins over several years. The Balance Sheet and Cash Flow APIs complement this by providing assets/liabilities and cash data. Together, they allow comprehensive financial modeling and ratio analysis. These APIs underpin key valuation metrics and are fundamental to quantitative models.
Each API above is documented with the endpoint URL and required parameters. Traders and analysts can combine them as needed - for example, using the Stock Symbol Search API to get a ticker, then fetching its quote, financial statements, and relevant calendar events (dividends, earnings) for a full picture of the company.
Putting It All Together — Building a Real-Time Data Workflow
FMP's APIs can be combined to create complete analytics pipelines that move seamlessly from market discovery to real-time monitoring and valuation. A workflow might follow this sequence:
- Use the Stock Symbol Search API to find a company ticker.
- Fetch its latest quote and intraday chart data for live market movement.
- Overlay that information with the Exponential Moving Average (EMA) API to detect short-term trends.
- Pull Earnings and Dividends Calendar APIs to identify upcoming catalysts or income events.
- Combine Financial Statements APIs for deeper fundamental and valuation analysis.
This integrated workflow powers real-time dashboards, automated trading systems, and research models that depend on live, normalized market data.
Example End-to-End FMP Real-Time Data Workflow
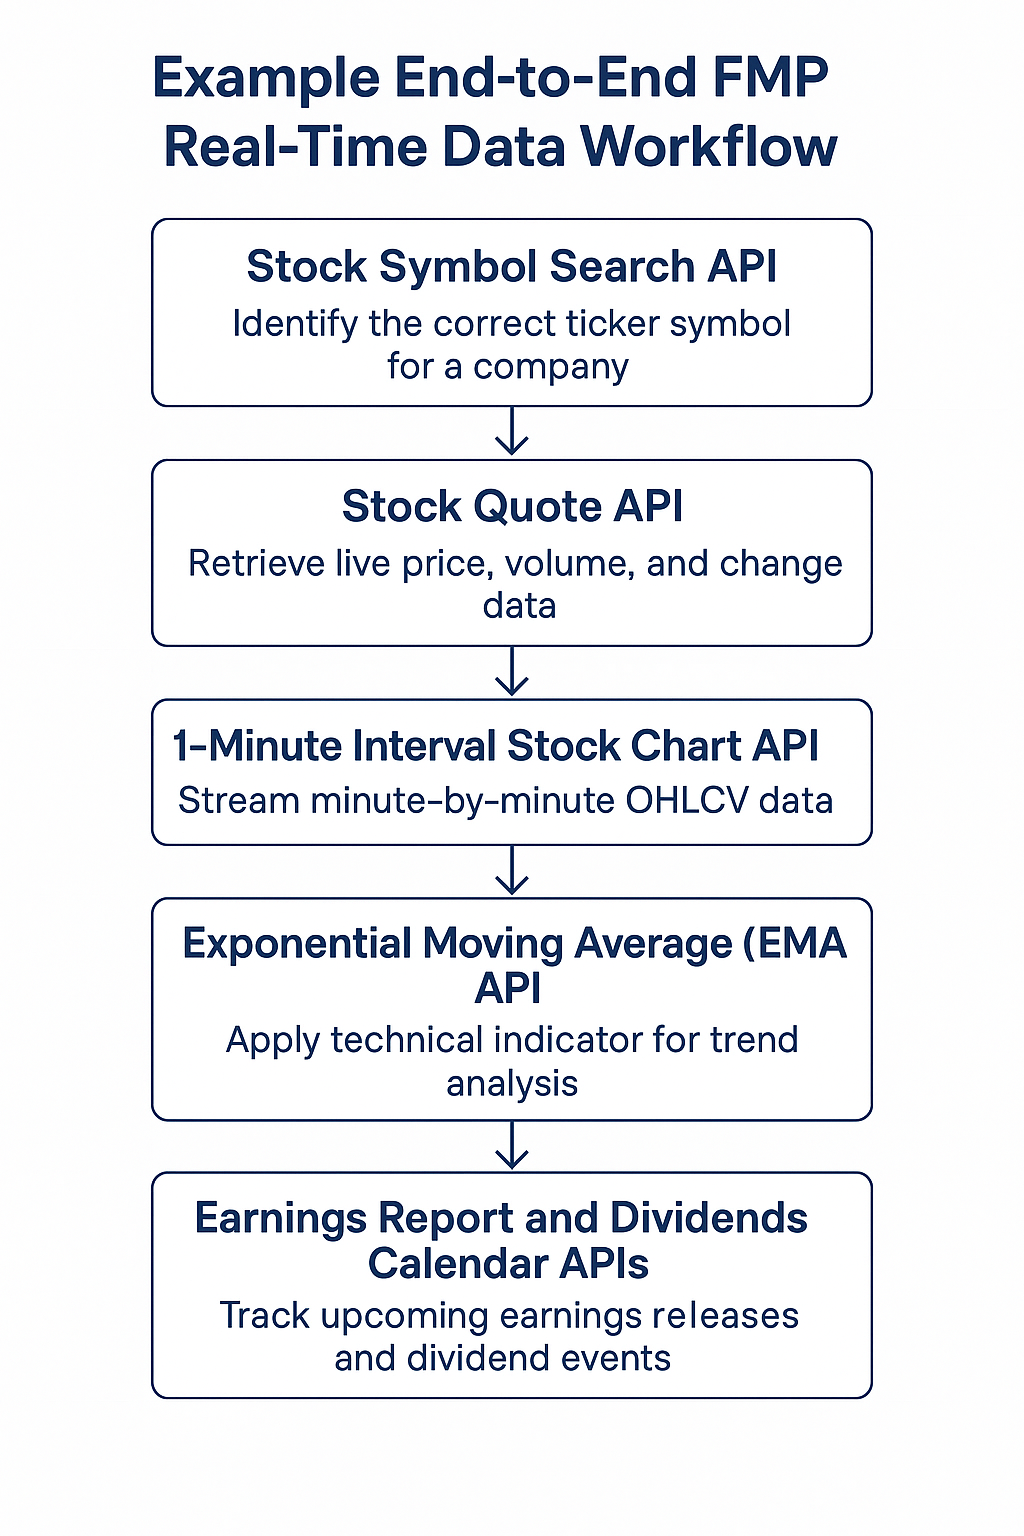
Together, these APIs form a complete framework for accessing, analyzing, and automating real-time financial data. Whether you're building dashboards, backtesting strategies, or managing compliance, FMP's unified architecture simplifies every stage of the market data process.
FAQ
What real-time APIs does FMP provide?
FMP offers a comprehensive suite of real-time stock market data APIs, including endpoints for live quotes, complete symbol lists, active trading stocks, exchange listings, sectors, industries, and more (as detailed above).
Are these APIs global or U.S.-only?
The APIs are global. FMP covers exchanges and securities worldwide - from U.S. markets like NYSE/NASDAQ to European, Asian, and other international exchanges. You can retrieve data for many countries and multiple currencies.
How can I integrate these endpoints with Python?
Integration is straightforward using HTTP requests. For example, with Python's requests library, you can call an endpoint like quote or stock-list and then handle the JSON data in your script. FMP's documentation and tutorials (e.g., “Retrieve Company Fundamentals with Python”) provide code snippets. Simply ensure you append your API key to the request URL, then use requests.get() and parse the JSON.
Which API lists actively trading companies?
The Actively Trading List API is designed for that. It returns all symbols that are currently active (trading) on exchanges, so you can exclude delisted or inactive tickers. This is the endpoint to use when you want to filter to “live” stocks only.
Do these APIs include ETFs and transcripts?
Yes. The Company Symbols and Actively Trading lists include ETFs and other instruments, not just individual stocks. There is also a dedicated ETF Symbol Search API for just ETFs. For transcripts, the Earnings Transcript List API specifically enumerates companies with available earnings call transcripts (and how many). So, FMP's suite covers both market data and related information like transcripts to give a complete picture of financial data availability.

MicroStrategy Incorporated (NASDAQ:MSTR) Earnings Preview and Bitcoin Investment Strategy
MicroStrategy Incorporated (NASDAQ:MSTR) is a prominent business intelligence company known for its software solutions a...

WACC vs ROIC: Evaluating Capital Efficiency and Value Creation
Introduction In corporate finance, assessing how effectively a company utilizes its capital is crucial. Two key metri...

BofA Sees AI Capex Boom in 2025, Backs Nvidia and Broadcom
Bank of America analysts reiterated a bullish outlook on data center and artificial intelligence capital expenditures fo...

